2 hours ago
Crypto assets extended losses last week as sell pressure gripped investors. Overall, institutional sales remained strong due to high Bitcoin (BTC) numbers, although altcoins traded in the opposite direction. Analysts expect a surge in altcoins like XRP, Solana (SOL), and Ethereum (ETH) with the influx of fresh institutional capital. This month, the wider market has traded sideways, wiping out previous gains. Altcoins Outpace Bitcoin Data from CoinShares Digital Asset Weekly Flows shows a general bearish sentiment in crypto assets last week. XRP institutional inflows gained $38.3 million in the previous seven days, up from monthly inflows of $68.9 million. This increase comes despite a major market selloff, restating bullish sentiments. XRP became an institutional favorite last year after speculation about a major price jump due to certain factors. Large-scale investors flock around altcoins linked to a spot ETF, as seen in Ethereum last year. These products are huge market drivers, opening up a new investment window for traditional players. XRP whales accumulated assets after institutional signals continued to soar. Aside from ETFs, an easing in US regulations set the tone for larger inflows. Following Donald Trump’s victory, XRP price soared from under the $1 mark to $3, hitting levels not seen in months. The asset temporarily displaced USDT as the third-largest crypto after its market cap soared above $140 billion. Currently, year-to-date (YTD) flows to XRP stand at $200 million due to a bullish January. Ethereum recorded $3.7 million in inflows, a slight increase compared to the total monthly gain of $789 million. This follows a sharp price drop below the $2,700 level after the infamous Bybit incident. YTD inflows are now over $984 million, with bulls looking to extend figures past the $1 billion mark. Solana and Cardano posted $9 million and $0.1 million inflows, respectively. Bitcoin Products Fall Short Bitcoin was the most affected digital asset from last week’s negative trading. Institutional exits totaled $571 million while overall net flows hit $508 million. Recent poor performance lowered sentiment as the price dipped below $100K. At this level, BTC traders hope to recover lost positions, but global macro factors pose a threat to bulls. “ We believe investors are exercising caution following the US Presidential inauguration and the consequent uncertainty around trade tariffs, inflation, and monetary policy. This is also evident in trading turnover, which has fallen considerably from US$22bn 2 weeks ago to US$13bn last week.”
ZyCrypto
You can visit the page to read the article.
Source: ZyCrypto
Tags :
Cryptocurrency News Bitcoin News Ethereum News Solana XRP News
Disclaimer: The opinion expressed here is not investment advice – it is provided for informational purposes only. It does not necessarily reflect the opinion of BitMaden. Every investment and all trading involves risk, so you should always perform your own research prior to making decisions. We do not recommend investing money you cannot afford to lose.
Dutch Crypto Manager Spies Path For Bitcoin to $150K By October

US tech stocks in the Nasdaq Composite traded down -6.96% for the 1M window ending Apr. 18. But at the time, Bitcoin’s price notched a gain just under 1% for the month’s trades. That’s after a remarkable 4-day, mid-April bounce back to the $85,000 handle from the first bear test as low as $75,000 since BTC soared past that level last November on its way to $109,000 on Jan. 20th. BTC Cup and Handle Indicator Meanwhile, Bitcoin prices on crypto exchanges formed a bullish cup and handle chart pattern on the 1M view. The cup formed over 8 days from Apr. 4 through Apr. 12, with a long 6-day handle through Apr. 18. 24H trade volume peaked at $98 billion on Apr. 7 in the middle of the cup and declined to below $21 billion by Friday, Apr. 18, as in many typical pre-rally markets. 18mo. Support Line for Bitcoin Prices That bullish cup and handle market signal occurred right around a crucial inflection point for Bitcoin’s price along its long-term trend lines. The total market capitalization trend continues to be upwards and is holding a crucial support level for #Crypto . pic.twitter.com/7uaK2IHs54 — Michaël van de Poppe (@CryptoMichNL) April 16, 2025 MN Capital founder Michaël van de Poppe posted on Wednesday: “The total market capitalization trend continues to be upwards and is holding a crucial support level for #Crypto.” The accompanying market chart for BTC displays the downward correction from $109,000 since January, converging with the long-term support trend line for Bitcoin’s price since Q3 2023. $150,000 BTC by October? If BTC markets repeat the July through January rally’s performance while staying above long-term support, its price would top $150,000 by October. That target is in line with other analysts’ expectations. UK mega bank Standard Chartered forecasts $200,000 Bitcoin inside of 2025 and $500,000 by 2029. Popular stock tips website Motley Fool says $200,000 BTC in 2025 is “fairly probable.” BlackRock’s Larry Fink says if something really crazy happens in large hedge funds, markets could face $700,000 BTC. The post Dutch Crypto Manager Spies Path For Bitcoin to $150K By October appeared first on CryptoPotato . ZyCrypto

Dogecoin Price Squeezes Into Triangle With Breakout Closing In
Dogecoin has been trading in a tight range lately, with its price movement increasingly narrowing over the past few days between $0.15 and $0.16. This increasingly narrowing range comes off a wider downside consolidation move since the beginning of April, which has led to the creation of a triangle pattern on the 4-hour candlestick timeframe chart. Related Reading: Today’s $1K XRP Bag May Become Tomorrow’s Jackpot, Crypto Founder Says As it stands, Dogecoin is trying to recover from earlier losses in April, and a recent higher low points to growing bullish activity that could send it pushing above the upper trendline of the triangle pattern in the coming week. Analyst Notes Classic Market Indecision In Dogecoin Structure Crypto analyst Trader Tardigrade recently brought attention to Dogecoin’s current price structure in a post shared on the social media platform X, noting a converging triangle formation that reflects growing indecision in the market. According to his analysis, Dogecoin’s price action has transitioned from a clear downtrend (visible throughout late March and extending into the first week of April) into a state of consolidation that has persisted over the past two weeks. Looking at the resulting triangle formation on the 4-hour candlestick timeframe chart, it is easy to infer that both buyers and sellers are exercising caution. Buyers are reluctant to enter at higher levels, while sellers seem unwilling to push prices lower, creating a narrowing band of price action since April 15. The result is a compression of volatility, which could break out in either direction. Image From X: Trader Tardigrade What Comes After The Indecision Phase? As shown in the Dogecoin price chart above, the memecoin is now approaching the tip of the triangle. In this particular case, the structure leans toward a bullish breakout, with market behavior showing signs of upward pressure building beneath the surface by a 2.77% increase in trading volume in the past 24 hours. Trader Tardigrade projected an uptrend that cancels out the downtrend in late March, following the classic pattern of a downtrend, indecision, and a resulting uptrend. A strong bullish candle that closes above the upper trendline of the triangle is important to validate the predicted uptrend. Trader Tardigrade’s projection shows that if such a move occurs, Dogecoin could reclaim the $0.20 level within a relatively short time frame before the end of the month. Dogecoin opened the month of April at $0.166. As such, a clean upside breakout followed by a sustained close above $0.20 would mark a positive finish for Dogecoin in April. Related Reading: BNB Weathers The Storm Better Than Altcoins, Stats Show Such a positive monthly close would likely influence market sentiment heading into May and possibly invite increased buying activity. It would also help confirm that the recent period of bearishness is over and help reestablish a bullish structure. At the time of writing, Dogecoin was trading at $0.1573 Featured image from 21Shares, chart from TradingView ZyCrypto
See Also

TRADING


ADA
-
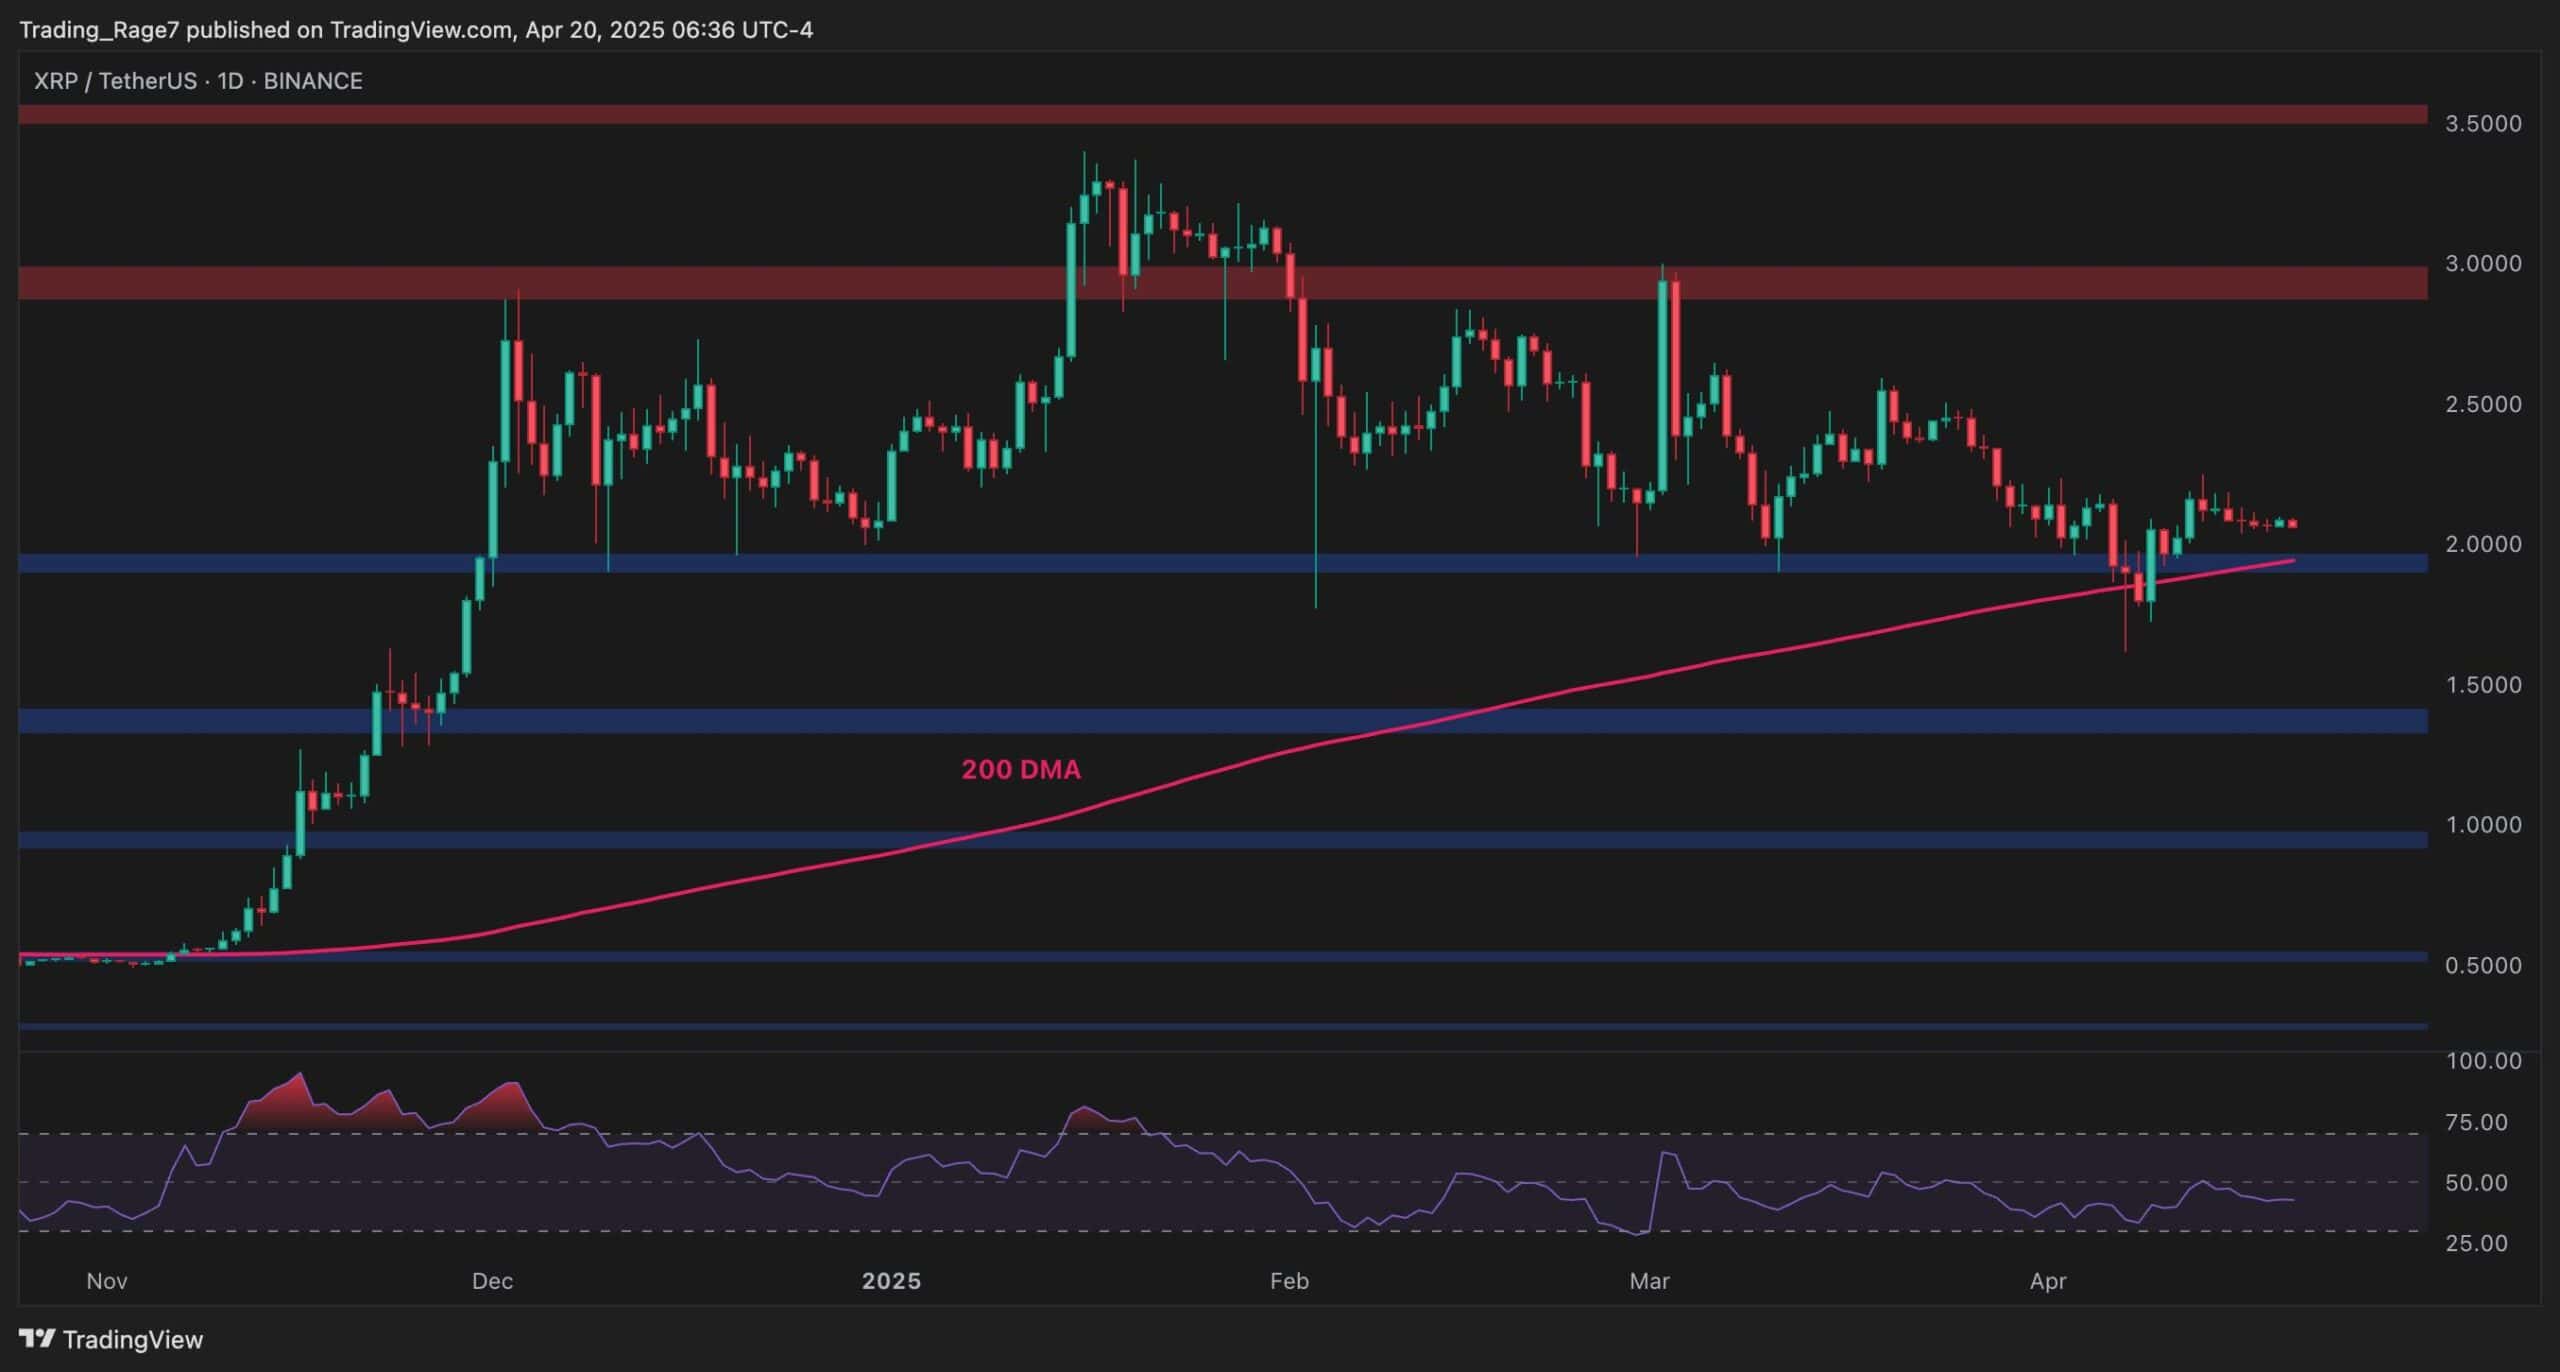
XRP Eyes Major Move Within The Next 8 Hours
1 saat önce