
2 hours ago
Democrat Senator Elizabeth Warren of Massachusetts says that the US markets will witness another meltdown if Fed Chair Jerome Powell loses his job because of President Trump. In a new interview on CNBC Squawk Box, Warren says that it would be disastrous for US markets if Trump somehow manages to force Powell out. “If Chairman Powell can be fired by the president of the United States, it would crash the markets in the United States. The infrastructure that keeps this stock market strong and therefore a big part of our economy strong, and therefore a big part of the world economy strong, is the idea that the big pieces move independent of the politics, that somebody is making their best decisions economically and independently. We understand that if the New York Stock Exchange, if interest rates in the United States are subject to a president who just wants to wave his magic wand, this doesn’t distinguish us from any other two-bit dictatorship around the world where everyone knows what your really big investment risk is w ill that dictator wake up in the morning and have a tummy ache and decide to cause this problem, or favor that friend? That’s why we need to strengthen the infrastructure.” Recently, Reuters reported that Trump is “studying” to see if he can fire Powell, who has served as the Fed Chair since 2018 and was appointed by Trump during his first term. Despite being Trump’s appointee, Powell’s relationship with Trump has been strained as of late due to conflicts in interest rate outlook. Trump wants the Fed to immediately cut interest rates, but Powell has determined that the right course of action is to be patient and keep rates steady. Follow us on X , Facebook and Telegram Don`t Miss a Beat – Subscribe to get email alerts delivered directly to your inbox Check Price Action Surf The Daily Hodl Mix Disclaimer: Opinions expressed at The Daily Hodl are not investment advice. Investors should do their due diligence before making any high-risk investments in Bitcoin, cryptocurrency or digital assets. Please be advised that your transfers and trades are at your own risk, and any losses you may incur are your responsibility. The Daily Hodl does not recommend the buying or selling of any cryptocurrencies or digital assets, nor is The Daily Hodl an investment advisor. Please note that The Daily Hodl participates in affiliate marketing. Generated Image: Midjourney The post US Markets Will Crash if President Trump Forces Fed Chair Jerome Powell Out, Warns Senator Elizabeth Warren appeared first on The Daily Hodl .
The Daily Hodl
You can visit the page to read the article.
Source: The Daily Hodl
Tags :
Regulators Crypto Donald Trump Elizabeth Warren Federal Reserve Jerome Powell News regulators stablecoins stock market
Disclaimer: The opinion expressed here is not investment advice – it is provided for informational purposes only. It does not necessarily reflect the opinion of BitMaden. Every investment and all trading involves risk, so you should always perform your own research prior to making decisions. We do not recommend investing money you cannot afford to lose.
Ripple Price Analysis: Will XRP Plummet Below $2 This Week?
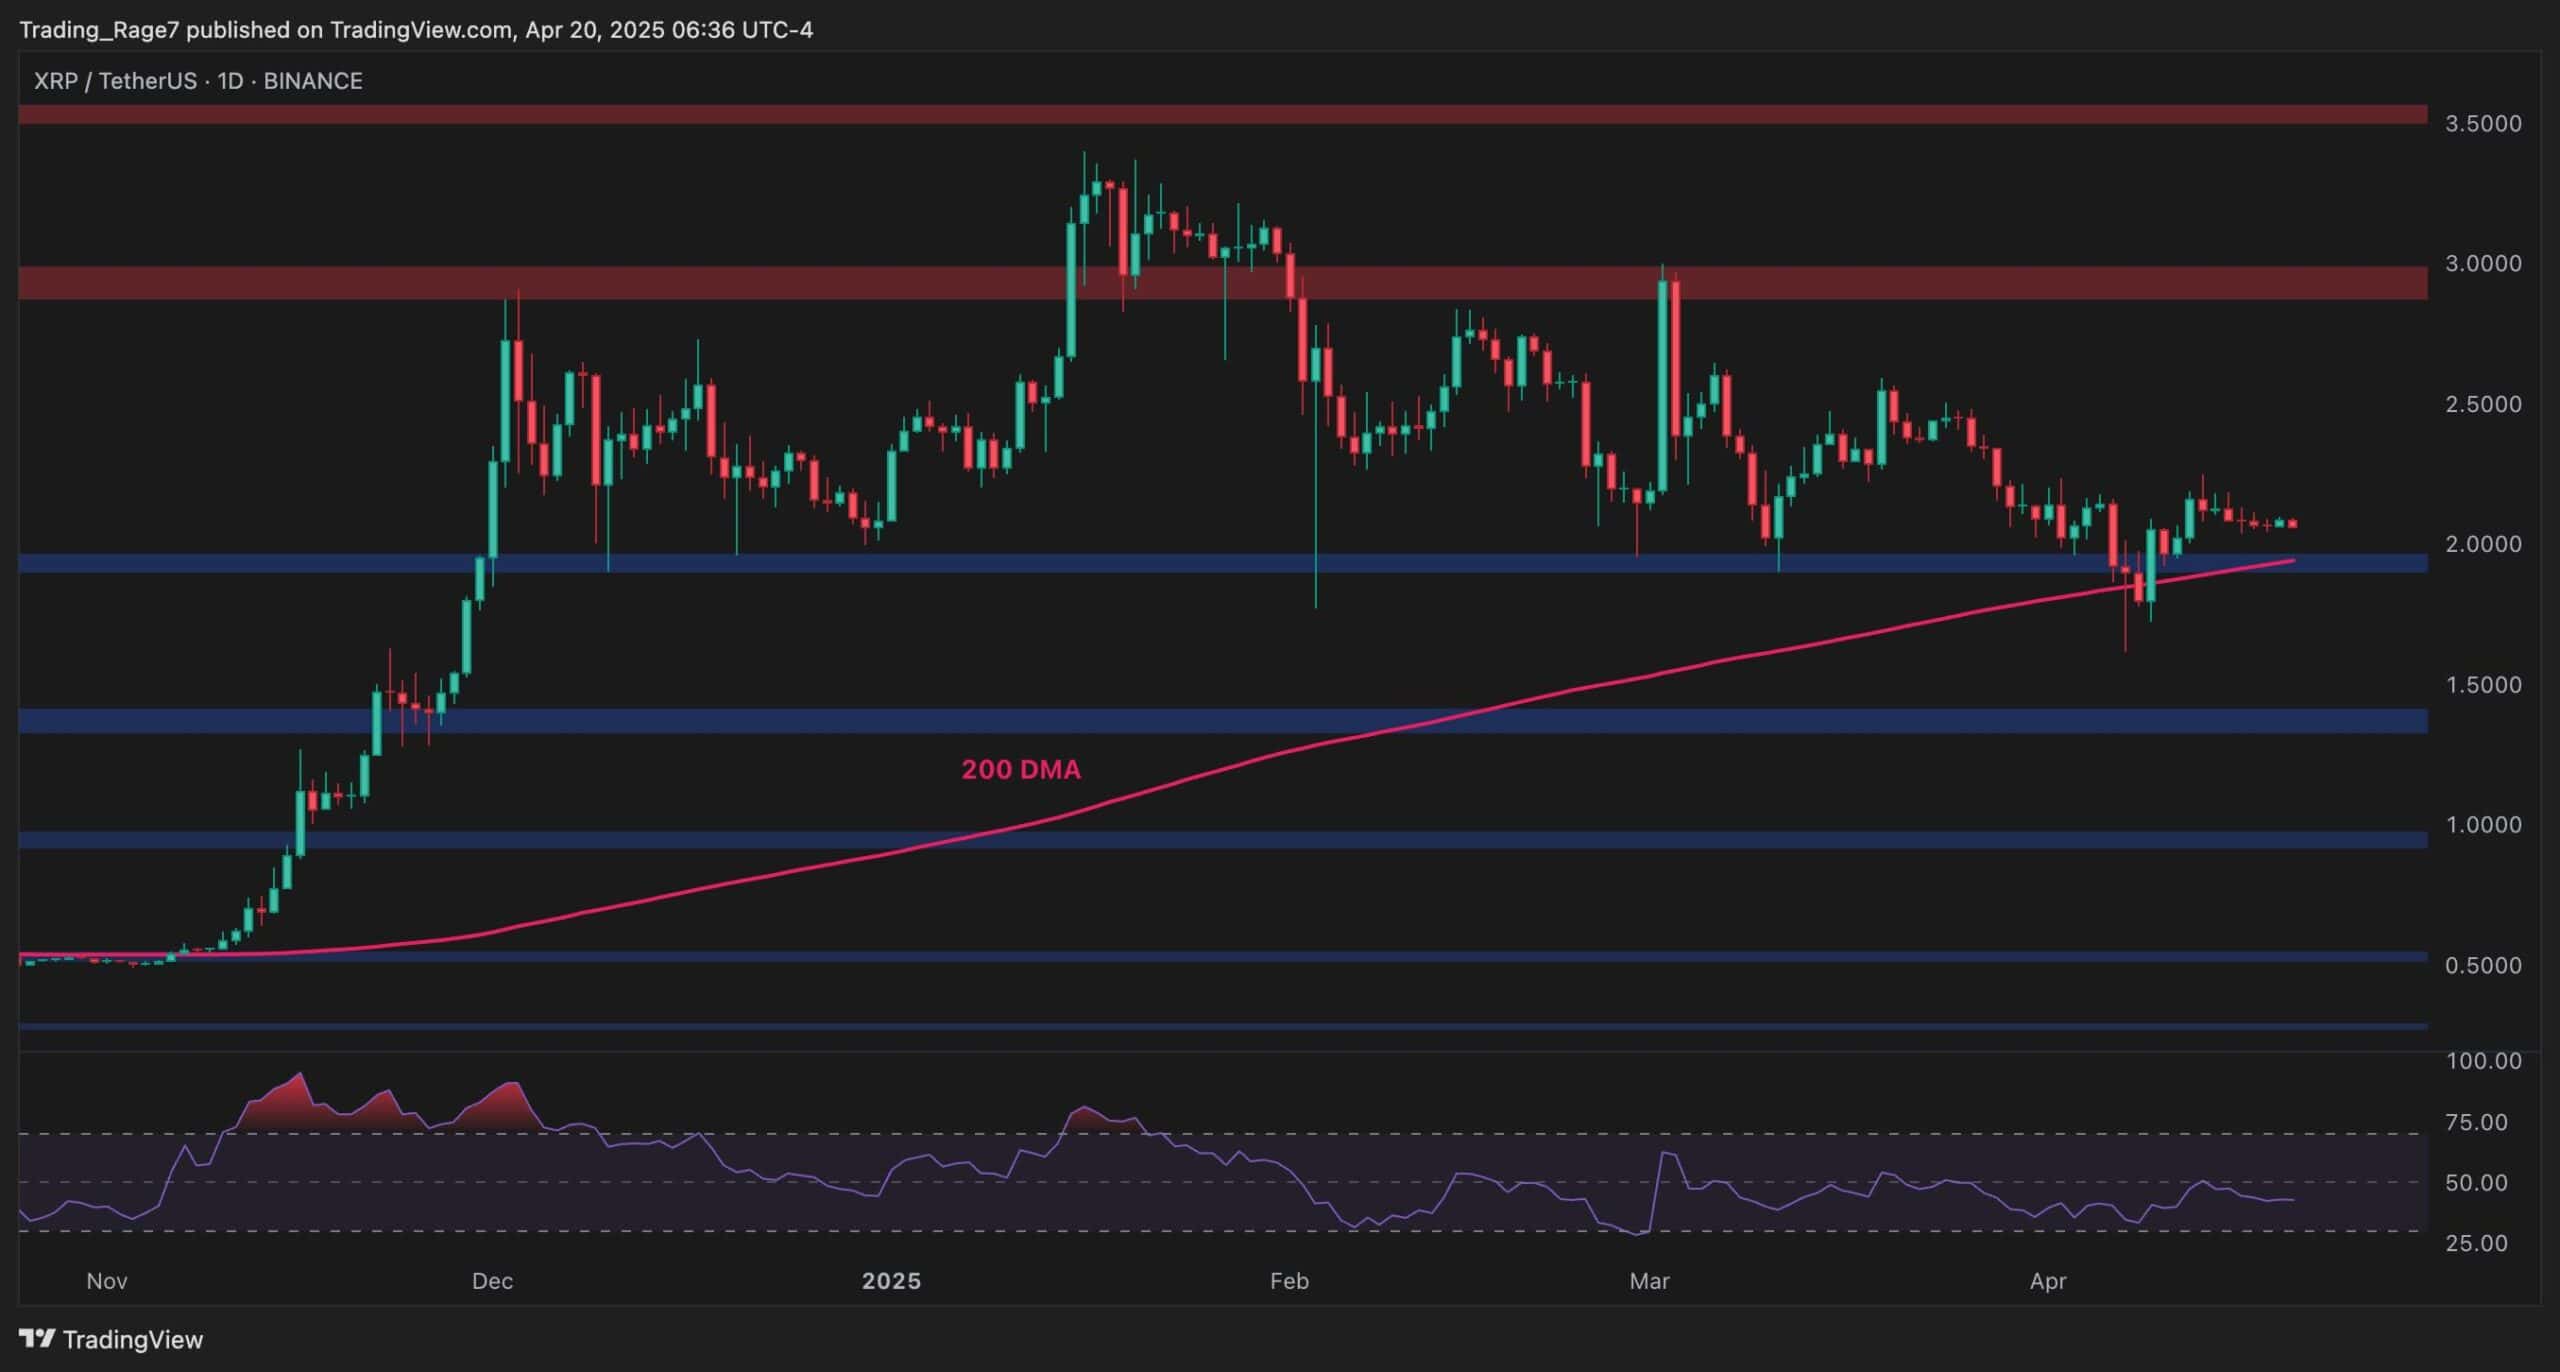
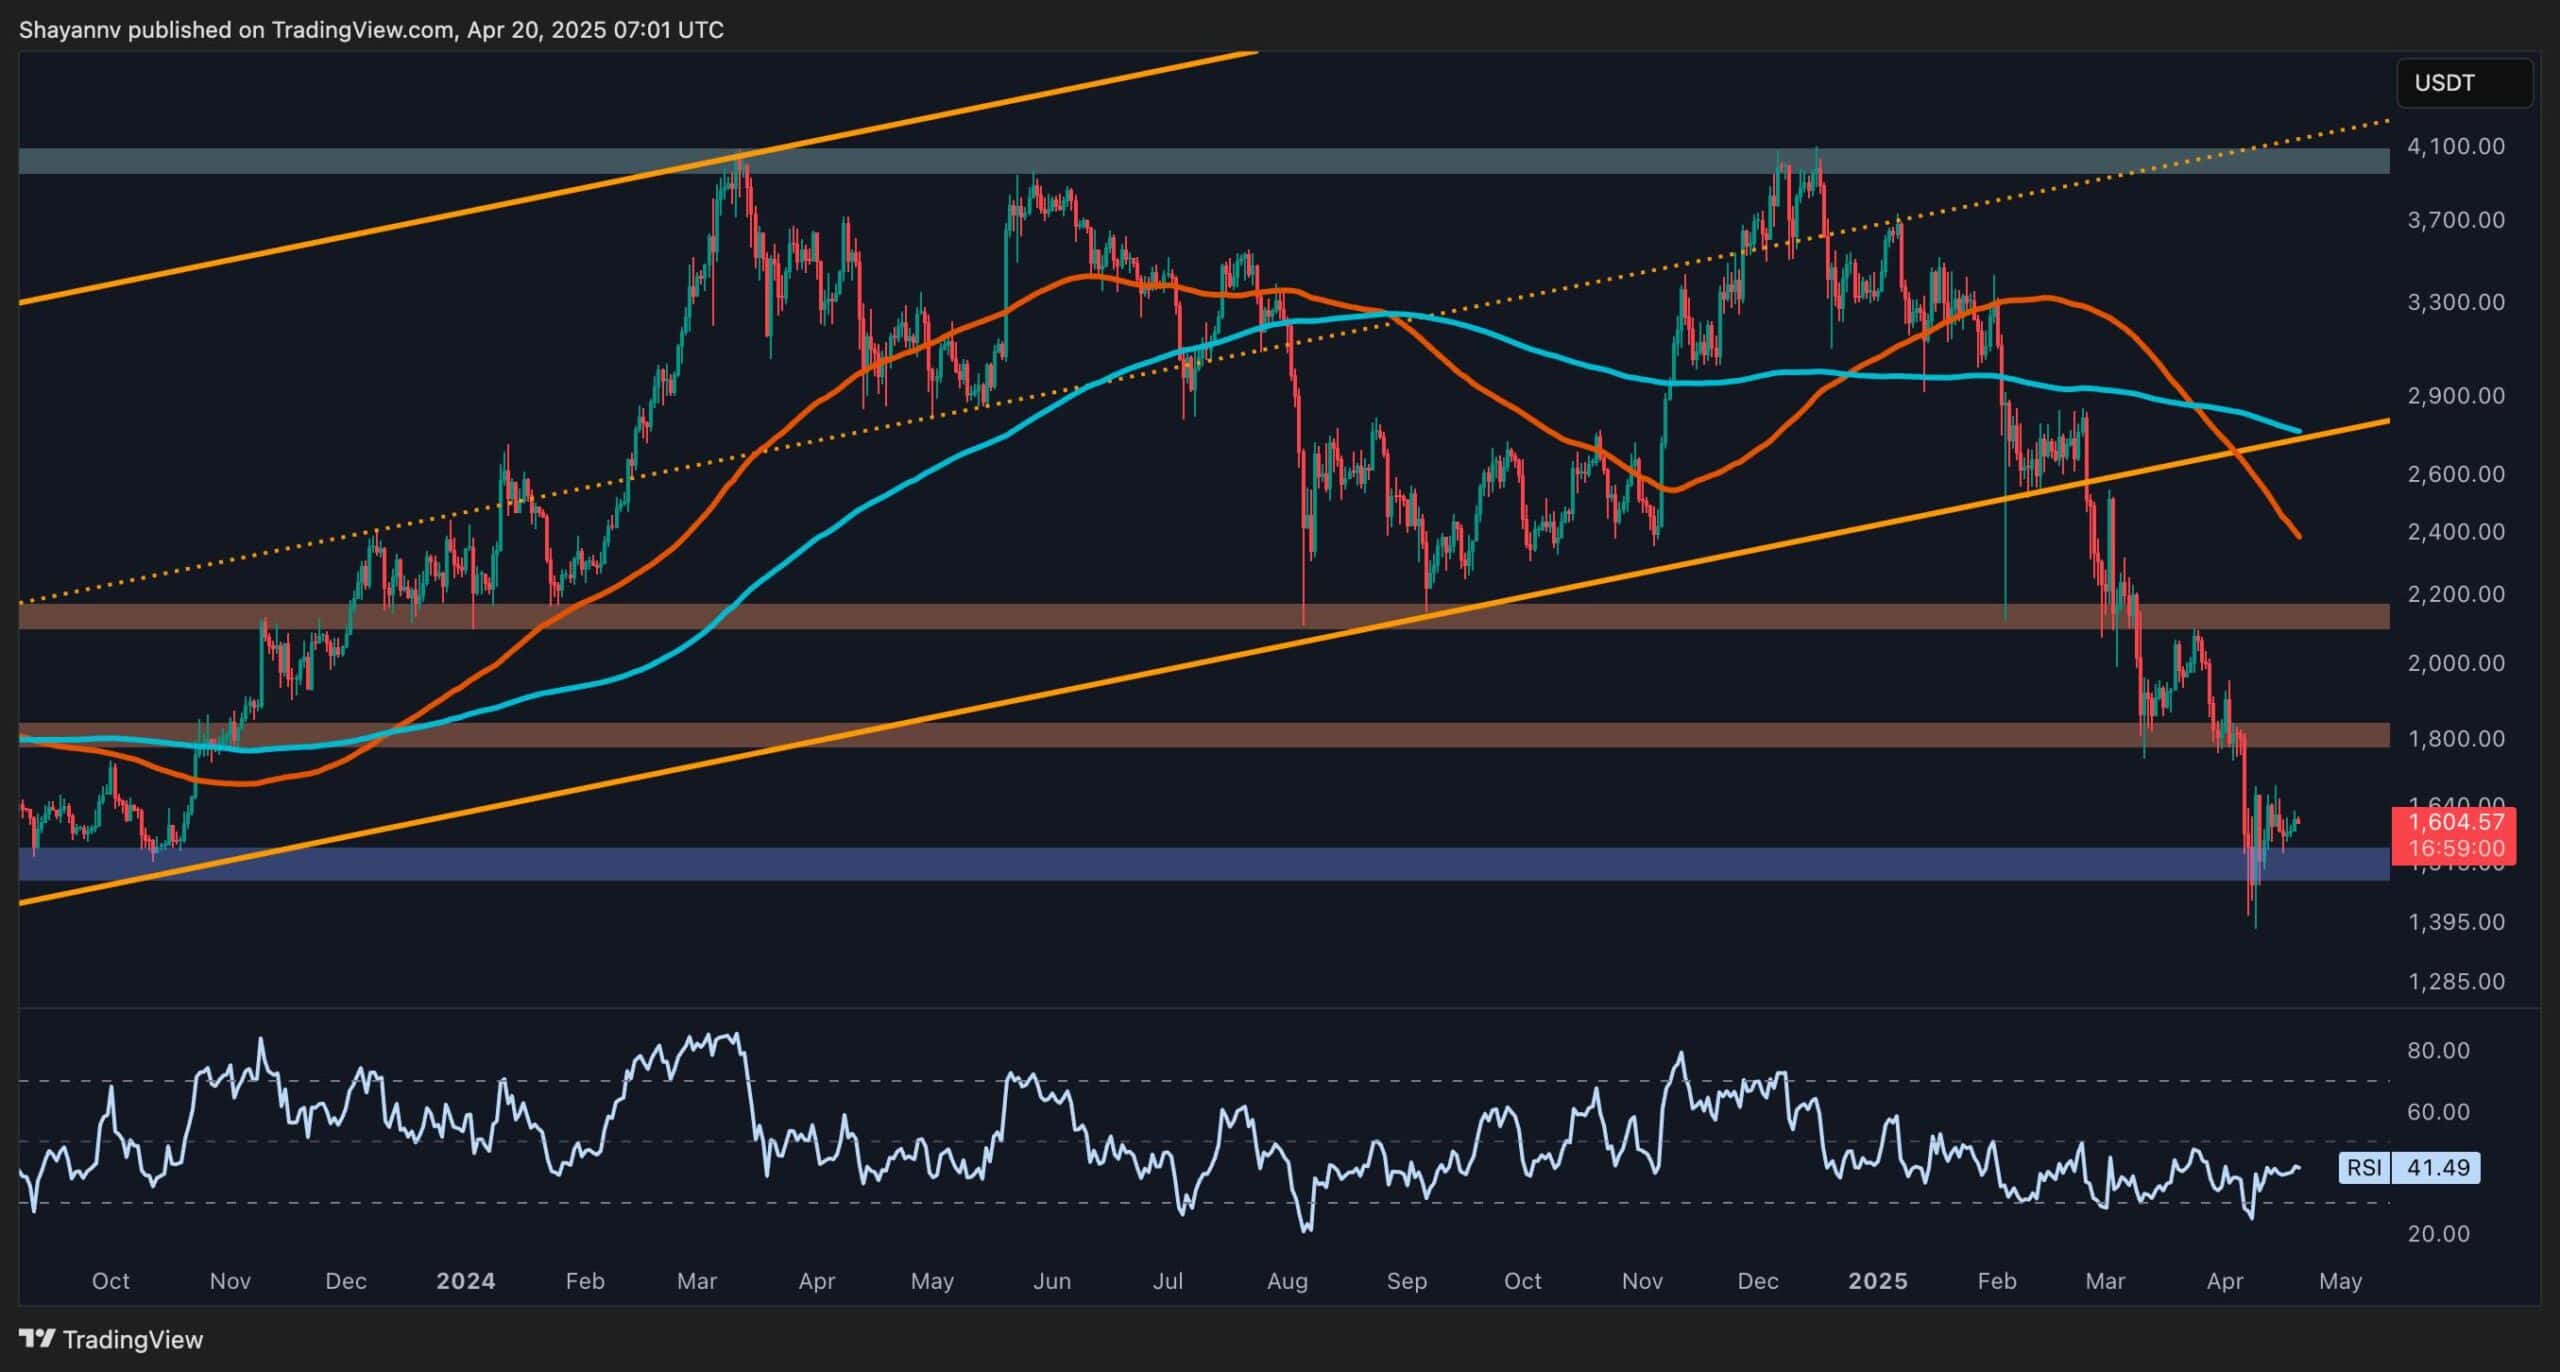
XRP continues to consolidate with low volatility across its BTC and USDT pairs. Price action is tight, holding above major support but struggling to gain bullish momentum. By Edris Derakhshi XRP Price Analysis: The USDT Chart XRP is holding just above the $2.00 support zone and the 200-day moving average, located around the same price mark. The $2.00 level has acted as key demand throughout April, with multiple wicks into that zone being bought up quickly. However, bullish follow-through has been weak, and the price remains compressed between $2.00 and the $2.40–$2.60 resistance zone. Momentum is neutral as the RSI hovers around the 50 mark. Bulls need to reclaim $2.60 to confirm strength and open the way toward the $3.00–$3.10 resistance. If the 200 DMA fails to hold, the next major supports are at $1.40 and $1. Source: TradingView XRP Price Analysis: The BTC Paired Chart XRP is still in a downtrend against BTC, with a clear sequence of lower highs since the peak in January. The price is now just above the 2,400 SAT level but well below the 2,800 SAT resistance zone. The 200 DMA near 2,100 remains a key level to watch if the decline continues. This pair continues to show relative weakness, and reclaiming 2,800 SAT is critical to shift the short-term trend. As long as XRP/BTC fails to break above that structure, upside will likely remain capped. Source: TradingView The post Ripple Price Analysis: Will XRP Plummet Below $2 This Week? appeared first on CryptoPotato . The Daily Hodl
ETH Price Analysis: Ethereum Drop to $1100 Not Impossible
Ethereum continues to suffer from extremely low market activity, with its price exhibiting minimal volatility – a concerning bearish signal. This stagnant behavior increases the likelihood of sellers pushing the cryptocurrency below the critical $1.5K support level in the coming weeks. Technical Analysis By Shayan The Daily Chart Ethereum continues to hover above the critical $1.5K support region, a long-standing psychological and structural level that has held since January 2023. However, the market currently exhibits extremely low activity, with the price consolidating in a muted, sideways manner. This lack of volatility and momentum suggests a state of uncertainty, with neither buyers nor sellers showing dominance. Such conditions often precede significant moves, as the market builds up energy awaiting new supply or demand. From a technical standpoint, bearish sentiment dominates the current price action. Should renewed selling pressure emerge, a decisive break below the $1.5K mark could trigger a cascade toward the $1.1K level. Still, a short-term corrective retracement toward the $1.8K resistance zone remains a possibility before sellers mount another attempt to breach the $1.5K support. The coming days are crucial, as price action around this level will likely dictate the direction of Ethereum’s next major trend. Source: TradingView The 4-Hour Chart On the 4-hour timeframe, Ethereum’s tight-range consolidation is clearly visible. The price is currently trapped between the $1.5K support and the upper boundary of the descending channel at $1.6K, reflecting a market in equilibrium. This balance suggests hesitation from both buyers and sellers. A breakout from this narrow range will be pivotal. If Ethereum manages to breach the $1.6K upper boundary, a short-term rebound toward $1.8K could materialize. Conversely, a breakdown below the $1.5K level will likely spark a significant downward move, potentially driving the price toward $1.1K in the mid-term. Source: TradingView Onchain Analysis By Shayan The funding rates metric serves as a crucial indicator of sentiment in the futures markets. Analysing its recent behaviour offers key insights into Ethereum’s potential next moves. Notably, both the price and the funding rates have been mirroring the patterns observed during the September to November 2024 period, a phase marked by prolonged consolidation and deep corrections that ultimately preceded a strong bullish rally. Such market conditions often reflect smart money accumulation, as informed investors take advantage of panic-driven selling and widespread distribution among retail participants. Currently, funding rates have dropped to near-zero values and are consolidating, suggesting that the market may once again be entering an accumulation phase. However, it is important to note that within such phases, further downside remains possible. The price may dip lower before a meaningful rebound occurs, offering even more attractive levels for accumulation by long-term investors. Source: CryptoQuant The post ETH Price Analysis: Ethereum Drop to $1100 Not Impossible appeared first on CryptoPotato . The Daily Hodl
See Also


MARKET


![Core [CORE] Leads Weekly Gainers Amid Market Volatility While Mantra [OM] Struggles to Recover](/image/6805455f2b714.jpg)

BTC
-
XRP Eyes Major Move Within The Next 8 Hours
1 saat önce