3 hours ago
Since mid-December, retail investors have been amassing Bitcoin at a speed not seen since the crypto bull market of late 2020 and early 2021. Investigating this recent phenomenon, we find that retail accumulation really took off around the time of the recent market lows in November and December and that retail investors are currently accumulating BTC even faster than a year ago and, in fact, at a pace that hasn’t been exceeded since the late 2020/early 2021 bull market. This rekindling of retail interest in Bitcoin, coming at a time when the cryptocurrency market is grappling with ongoing volatility and with the recent bear market clearly now behind us, is a clear sign that the confidence of recent retail investors remains very much intact. Since mid-December, retail investors (≤1 $BTC ) have been accumulating #Bitcoin at an accelerated pace, stacking an average of 10,627 BTC per day – 72% faster than the past year`s average (6,177 #BTC /day): https://t.co/K3Q9Dlu7jn pic.twitter.com/U0u6gIxXeB — glassnode (@glassnode) February 7, 2025 Retail Investors Lead the Charge: A Strong Shift from November This substantial uptick in retail activity stands in marked contrast to the pattern of retail investor behavior during November 2024, when Bitcoin pushed past the $100K threshold. At that time, many retail investors seemingly took advantage of the price spike by selling off portions of their holdings—profiting, one would assume, from what appeared to be a market moment of peak strength. This recent alternative uptrend, however, suggests that retail investors are now professing to view Bitcoin more as a long-term, fundamentally sound store-of-value proposition, rather than as a momentarily flaming, short-term speculative asset. It is accumulating Bitcoin at a rate that is hard to ignore. This is significant, particularly because retail investors usually have a much smaller presence in the market compared to institutions and larger players. Yet here they are, pushing into Bitcoin at 72% faster than last year’s pace—an act that is, in aggregate, a very apparent vote of confidence in both the original crypto and its future. And that’s with all that’s been going on in the space since summer. Whales Distribute Bitcoin, Increasing Sell-Side Pressure Retail investors are steadily accumulating Bitcoin, but on the other side of the trade, “whales”—investors holding more than 1,000 BTC—have been distributing their Bitcoin to exchanges at an ever-increasing rate. Since November 24, 2024, these large holders have been offloading, on average, nearly 33,000 BTC per day. That’s roughly 9 times their own annual average prior to their recent selling spree, which has been creating by far the largest and most consistent “sell-side” pressure the Bitcoin market has seen in years. The conduct of whales straying from the retail trend implies that they might be responding to more sweeping market conditions, such as recent ups and downs in the price of Bitcoin and the mood surrounding it. In contrast to the retail investors who have been steadily purchasing Bitcoin, the whales have been using the recent price surge as an opportunity to sell off a significant portion of their holdings. If they are not actively seeking to drive the price down, which is certainly a possibility, their price decline and market uncertainty anticipation could very well be leading them to liquidate massive portions of their BTC holdings. Bitcoin Dominance Rises, Capital Rotation Accelerates While the retail and whale sectors are moving in different directions, Bitcoin market dominance is soaring. Since the collapse of FTX, Bitcoin’s market dominance has risen from 38% to 59%, which means a substantial net capital rotation into Bitcoin to the detriment of other digital assets. What does this say about the state of investor confidence in not just Bitcoin, but in the whole digital asset space? Bitcoin dominance has surged from 38% to 59% since the FTX collapse, reflecting a net capital rotation into BTC over other digital assets: https://t.co/I1rZLhGP9n pic.twitter.com/00WQ6Tboa8 — glassnode (@glassnode) February 7, 2025 Bitcoin’s dominance surge is not just new money flooding into the space; it’s a sign that investors are favoring the stability and reputation of Bitcoin—more than ever—over the potential risks associated with altcoins. Result: Altcoins are growing slower. Over the same time frame (the lows of 2022 to now), we saw Bitcoin grow 5.3 times in market cap from $363 billion, to $1.93 trillion. Meanwhile, altcoins grew at a much-more-modest 4.7 times from their low point, to $892 billion in market cap. Significant Movement from Long-Term Holders A critical new development in the Bitcoin market is the transition of over 20,000 BTC from long-term holders’ wallets in the last 96 hours. This shift could very well change market dynamics because it has historically been the case that long-term holders are the most steadfast Bitcoin investors, the ones who ride out the periods of volatility. When it is the long-term holders’ turn to start moving coins, it usually means either portfolio repositioning or imminent market opportunity (often cited as the reason for the SEC’s lawsuit against Ripple). This transition could also represent an entry point—and a signal for new investment opportunities—for investors who are currently sidelined. Outflows from Bitcoin Spot ETFs Raise Concerns Though retail accumulation in Bitcoin has been robust, the recent outflows from Bitcoin spot exchange-traded funds (ETFs) have caused some consternation among investors. As of February 6, the total net outflow from Bitcoin spot ETFs since the start of the year was $140 million. Fidelity’s Bitcoin ETF (FBTC) was the biggest offender, with $103 million having left that fund, and no doubt many Heaven’s Gate figures were drawn during the put option writing that led to that fund’s availability. Still, Fidelity appears to be the only player with such active imitative undermining occurring. Over 20,000 #Bitcoin $BTC have moved out of long-term holders` wallets in the last 96 hours. This shift could introduce new opportunities! pic.twitter.com/RqTqteq5Ed — Ali (@ali_charts) February 7, 2025 The outflows from Bitcoin ETFs come at a time when the market capitalization of Bitcoin has been growing by leaps and bounds, which raises questions about just how hungry institutional investors are for the digital asset. Accumulation by retail investors shows no signs of slowing, yet that strong narrative is clouded by the series of unfortunate events that seem to have befallen the Bitcoin ETF this year and last. If the ETF is seemingly cursed, what does that say about the institutional investors that are supposed to be it? On February 6, the total net outflow of Bitcoin spot ETF was $140 million, and the outflow of Fidelity FBTC was $103 million. The total net inflow of Ethereum spot ETF was $10.6519 million, and the net inflow continued for 6 days. https://t.co/59u0BnEqLG — Wu Blockchain (@WuBlockchain) February 7, 2025 A Dynamic Market with Contrasting Trends The Bitcoin market right now is moving in two opposite directions. Retail investors are amassing large amounts of Bitcoin, @ investopedia.com demonstrating a healthy “HODL” attitude. Whale activity has also been noticeable, with large Bitcoin holders appearing to distribute their Bitcoin, increasing selling pressure and possibly creating a Bitcoin market that is more price-volatile than what we saw in 2020. In the middle of all this is Bitcoin’s price. Despite these major trends, Bitcoin’s price continues to reflect the kind of stability and overall bullishness we’re coming to expect when we look at the price charts. The market seems to be at a crossroads with long-term holders starting to move their BTC and institutions pulling money out of Bitcoin ETFs. These outflows suggest that retail investors are still quite confident in Bitcoin, while the big players in the market (both institutional and whale) are seemingly recalibrating their strategies. The evolution of Bitcoin continues, and by all appearances, it’s still looking good. Disclosure: This is not trading or investment advice. Always do your research before buying any cryptocurrency or investing in any services. Follow us on Twitter @nulltxnews to stay updated with the latest Crypto, NFT, AI, Cybersecurity, Distributed Computing, and Metaverse news ! Image Source: beibeinside / 123RF // Image Effects by Colorcinch
NullTx
You can visit the page to read the article.
Source: NullTx
Tags :
Crypto News bitcoin btc crypto cryptocurrency ETF ETFs trading
Disclaimer: The opinion expressed here is not investment advice – it is provided for informational purposes only. It does not necessarily reflect the opinion of BitMaden. Every investment and all trading involves risk, so you should always perform your own research prior to making decisions. We do not recommend investing money you cannot afford to lose.
Hong Kong Considers Bitcoin and Ethereum as Valid Assets for Immigration Applications

Hong Kong has announced a significant shift by approving Bitcoin and Ethereum as recognized proof of assets for investment immigration applications. This decision paves the way for new crypto investors, NullTx
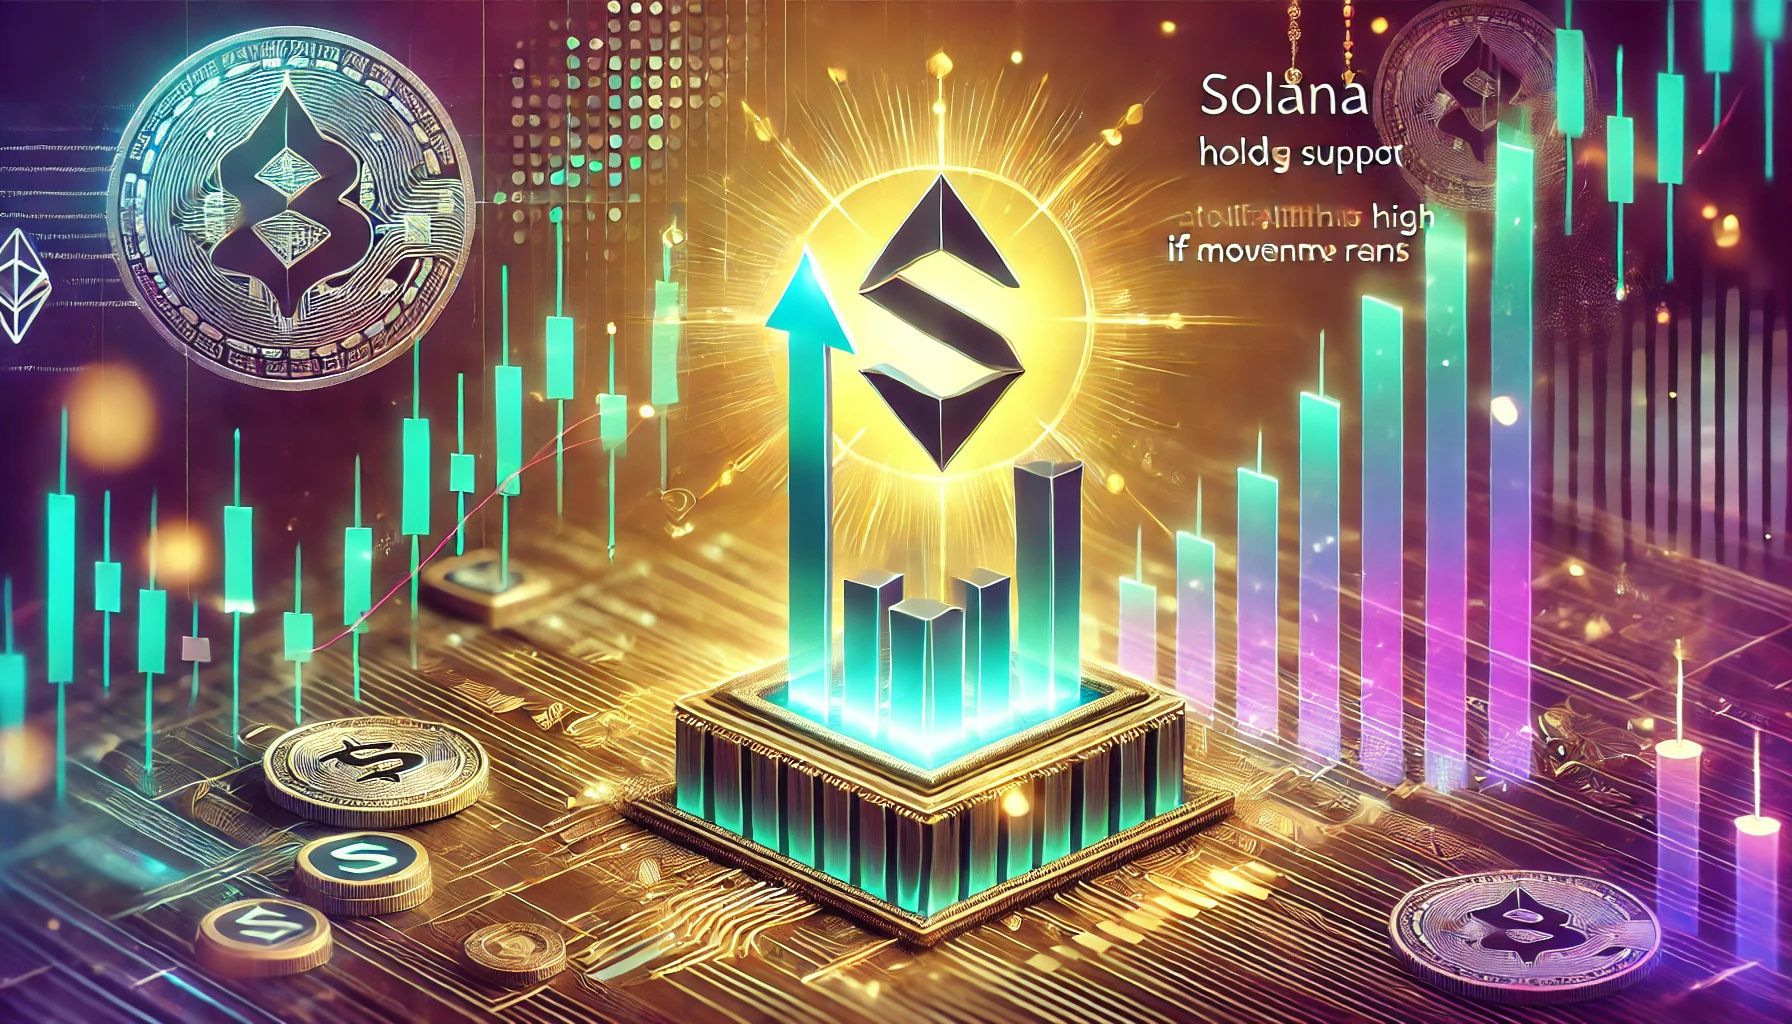
Solana Holds Support Above Key Indicator – Expert Sees Push To ATH If Momentum Returns
Solana has faced relentless selling pressure since late January, wiping out over 40% of its value after reaching all-time highs. Price action remains bearish, with SOL struggling to find strong support as the broader market experiences volatility. Investors are increasingly cautious, fearing that further declines could follow if key levels fail to hold. Related Reading: Ethereum Is Consolidating After The Flush Last Weekend – The Calm Before A Big Move? However, analysts believe Solana could see a swift recovery if it manages to maintain its current structure. Top analyst Daan shared a technical analysis on X, revealing that Solana is still hanging around above a key diagonal trend line and the Daily 200MA/EMA. This suggests that if SOL holds this area, it could regain strength and push higher in the coming weeks. While Solana’s price action has been concerning, the overall structure still looks intact. If the market regains momentum, SOL could quickly reclaim lost ground and make another run toward its previous highs. The coming days will be crucial as investors watch whether Solana can defend its support levels or if further downside is on the horizon. A strong bounce from current levels could mark the beginning of a new bullish phase for SOL. Solana Testing A Crucial Level Solana is trading at a critical zone after dropping more than 14% since Tuesday, testing the last support level that maintains its long-term bullish structure. Investors are growing concerned as selling pressure intensifies across the broader crypto market. If SOL fails to hold its current demand level, it could face sustained selling pressure, potentially leading to a deeper correction. Daan shared a technical analysis on X, noting that Solana is still holding above a diagonal trend line and the Daily 200MA/EMA. As long as this area remains intact, the structure looks decent for a potential rebound. He emphasized that these support levels have historically played a crucial role in determining SOL’s trend direction, making them a key focus for traders and investors. However, Daan also pointed out a technical concern regarding the two sweeps of the 2021 all-time high, which could indicate market uncertainty. Despite this, he believes that if the market finds momentum again, Solana could recover quickly and make another run toward higher price levels. Related Reading: Massive XRP Accumulation – Whales Bought 520 Million XRP During Market Dip For now, SOL’s ability to hold above key support levels will determine its short-term direction. If bulls manage to defend these areas and push the price back above resistance, a strong rebound could be in play. SOL Price Action: Technical Levels To Hold Solana (SOL) is trading at $192 after a volatile and bearish start to February. The price is currently holding at the 200-day exponential moving average (EMA) and remains 5% above the 200-day simple moving average (SMA), signaling that this is a critical moment for bulls to step in and defend the long-term trend. If SOL manages to hold above these key indicators, the next objective for bulls will be reclaiming the $200 mark, a psychological and technical resistance level. A successful push above this level would signal strength and set the stage for a larger recovery in the coming weeks. However, if SOL fails to hold above the 200-day EMA and loses this crucial support, the price could face a significant drop toward lower demand areas around $170. This would confirm a deeper correction and extend the bearish momentum that has dominated the market since late January. Related Reading: Bitcoin Support Sits At $90,6K Short-Term Holder Realized Price – Expert Reveals Key Resistance Level With the market still under pressure, SOL’s ability to defend its long-term moving averages will determine its next move. A rebound from these levels would indicate bullish resilience, while a breakdown could accelerate selling pressure and push the price further into lower demand zones. Featured image from Dall-E, chart from TradingView NullTx


MARKET


EXCHANGE
-

POPCAT Token Surges by 22% Following Recent Listings
52 dakika önce