1 days ago
Ethereum surprised the market with a powerful bounce on Wednesday, surging more than 21% from its recent low of $1,380. The move came shortly after US President Donald Trump announced a 90-day pause on reciprocal tariffs for all countries except China, which now faces a 145% tariff. This development injected optimism into global markets, triggering a broad recovery across risk assets — with ETH among the top beneficiaries. Related Reading: Dogecoin Whales Buy Over 80 Million DOGE In 24 Hours – Sign Of Recovery? Despite the relief rally, Ethereum still trades below critical technical levels, and the broader price structure suggests ongoing consolidation rather than a confirmed reversal. Analysts remain cautious, as the asset’s inability to reclaim the $1,800–$2,000 range keeps the long-term trend in question. However, on-chain data from CryptoQuant adds an intriguing layer to the current outlook. Ethereum’s price is still trading below its realized price — the average price at which all ETH in circulation last moved. Historically, this scenario has represented a high-probability accumulation zone, often appearing once per cycle. According to some analysts, this could present a rare buying opportunity for contrarian investors willing to look beyond short-term volatility and macro uncertainty. As Ethereum continues to consolidate, all eyes are on whether bulls can build on this momentum. Ethereum Faces Critical Test Amid Volatility And Trade Tensions Ethereum is at a pivotal point after enduring weeks of relentless selling pressure and extreme volatility. The broader market has been shaken by macroeconomic uncertainty and escalating global trade tensions, with US tariffs under Trump’s administration continuing to rattle investor confidence. The crypto market, particularly altcoins like Ethereum, has taken the brunt of this instability. ETH has lost over 60% of its value since late December, raising fears of a prolonged bear market. However, a shift may be unfolding. Bulls are beginning to reappear, with Ethereum bouncing and setting a strong support above $1,400. This recovery follows aggressive price swings not only in crypto but also in global equities, which have seen significant rebounds following the announcement of a 90-day pause on reciprocal tariffs for all countries except China. Still, Ethereum remains below crucial resistance levels, especially the $2,000 mark — a level that represents more than just a psychological barrier. According to top analyst Quinten Francois, ETH is currently trading under its realized price, which averages the cost basis of all coins in circulation. Historically, such conditions have presented rare buying opportunities. Francois suggests this might be a once-in-a-cycle — or even once-in-a-lifetime — chance for long-term investors to accumulate ETH at undervalued levels. The coming days will determine whether bulls can reclaim key resistance and shift sentiment toward a sustained recovery. Related Reading: Solana Approaches $125 – Will 2-Level Filter Trigger A Long Signal? Price Action Details: Key Levels To Reclaim Ethereum is currently trading at $1,650 after failing to break above the $1,700 level, a psychological and technical barrier that continues to cap bullish momentum. Despite a sharp rebound earlier in the week, ETH remains stuck in a consolidation range and is struggling to find direction amid broader market uncertainty. For bulls to regain control and initiate a stronger recovery, Ethereum must push above the $1,850 mark — a level aligned with the 4-hour 200-day moving average (MA) and exponential moving average (EMA). These indicators have acted as short-term resistance since ETH fell below the $2,000 mark in February and reclaiming them is critical for confirming a shift in trend. Related Reading: Bitcoin Long-Term Holders Show Conviction: 63% Of Supply Hasn’t Moved In A Year However, if Ethereum fails to break above $1,750 in the coming days, downside risk increases significantly. A rejection at current levels could trigger another wave of selling, potentially sending the price below the $1,500 support zone. This would put further pressure on bulls and undermine recent gains. With market sentiment still fragile and macroeconomic uncertainty weighing on investor confidence, Ethereum remains at a crucial juncture where a decisive move above resistance is needed to shift the outlook from bearish to neutral. Featured image from Dall-E, chart from TradingView
NewsBTC
You can visit the page to read the article.
Source: NewsBTC
Tags :
Ethereum ETH ethereum Ethereum Bullish Signal Ethereum Cycle ethereum news ethereum price Ethereum Realized Price ETHUSDT
Disclaimer: The opinion expressed here is not investment advice – it is provided for informational purposes only. It does not necessarily reflect the opinion of BitMaden. Every investment and all trading involves risk, so you should always perform your own research prior to making decisions. We do not recommend investing money you cannot afford to lose.
Why Bitcoin will retest resistance at $99,500

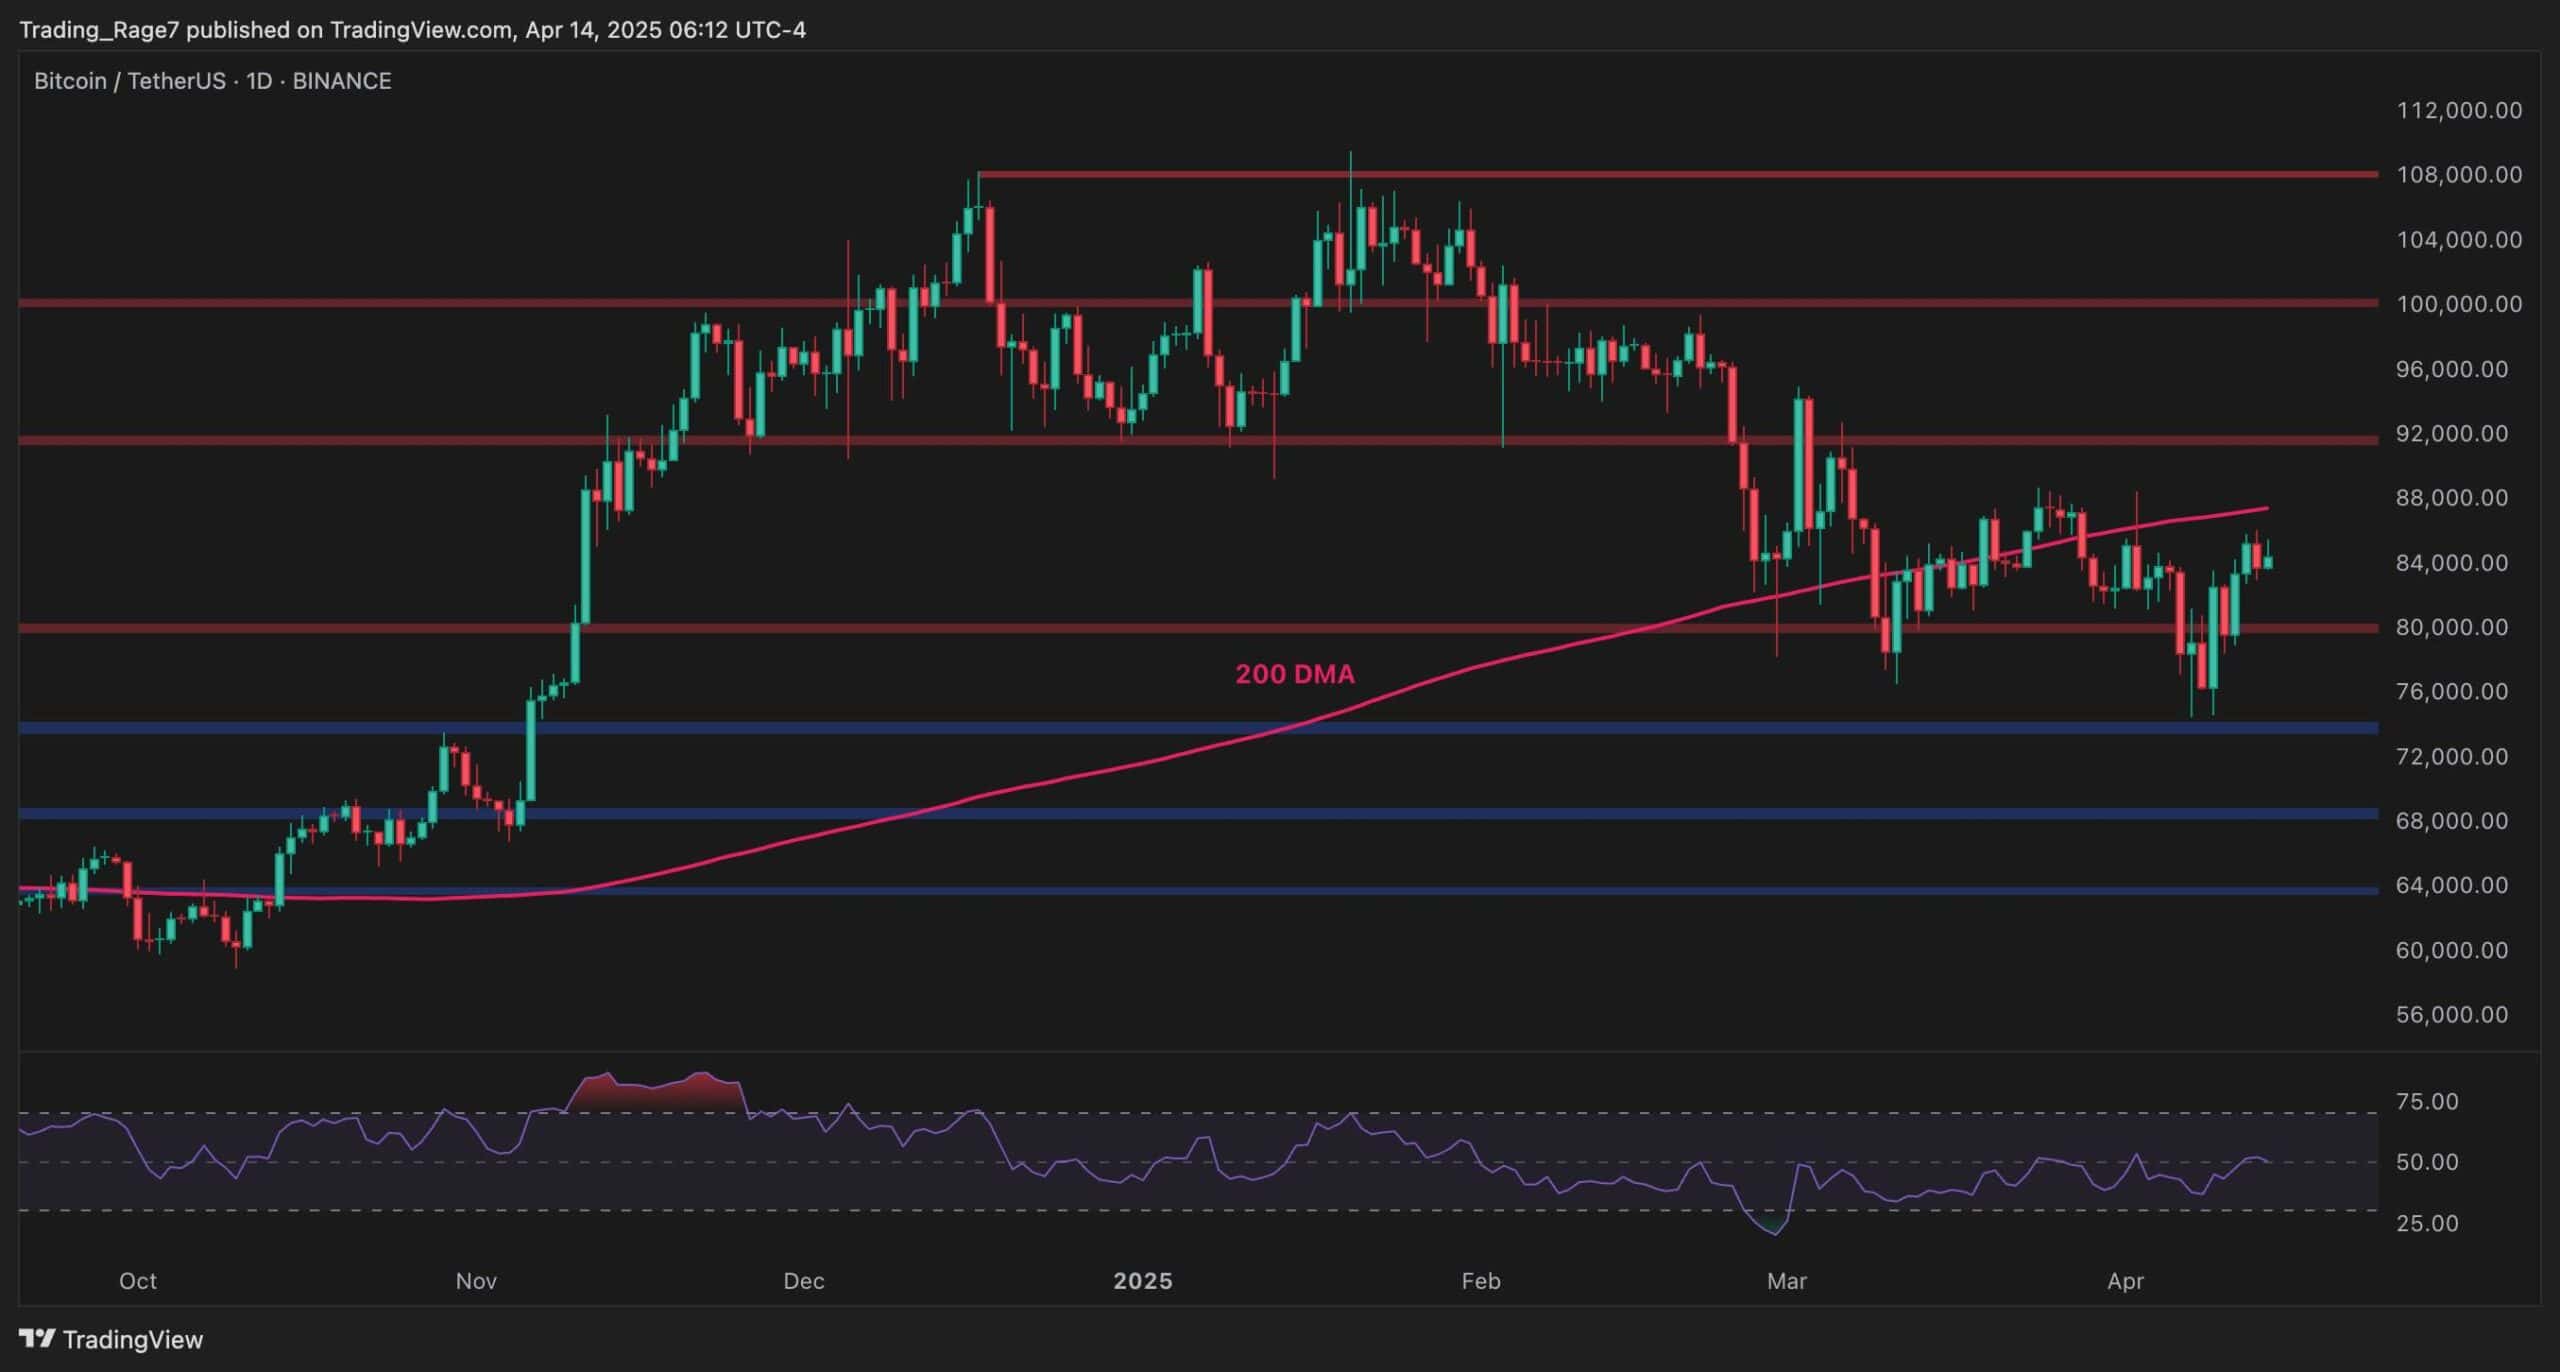
Technical analysis suggests that the leading digital asset could soon test levels close to the psychologically important $100,000 mark. The most important Bitcoin ( BTC ) resistance level currently sits at $99,500, and it held firm in the weeks preceding the tariff selloff. Despite having crashed below $80,000 in the aftermath of the tariff exchange, BTC prices recovered rather quickly. At press time, the leading cryptocurrency was changing hands at a price of $84,750, having rallied by 10.37% in the past seven days. BTC price 1-week chart. Source: Finbold As of the time of writing, Bitcoin is still down 9.38% since the year began. However, a surge to $99,500 would see it back in the green on a year-to-date (YTD) basis. Here’s why that is a distinct possibility. Bullish divergence suggests Bitcoin resistance will soon be retested Noted cryptocurrency technical analyst TradingShot outlined several arguments as to why a surge in BTC price could ensue in the immediate term in an April 14 TradingView post . For one, Saturday’s close on the daily chart is above the asset’s 50-day moving average ( MA ). This is the first time this has occurred since February 3. Up to this point, price had tested the MA 6 times, only to get rejected in each case. Moreover, recent price action has breached a trendline of lower highs charted since the January 20 all-time high (ATH) — if just barely. BTC price chart with technical analysis. Source: TradingShot on TradingView Lastly, all of this has happened in conjunction with Bitcoin marking lower lows in terms of prices, as well as lower highs in terms of its Relative Strength Index ( RSI ), indicating a bullish divergence that suggests the asset will not trend toward oversold levels going forward. In such instances, traders use a 2.0 Fibonacci extension level as a price target. This time around, it sits at the $99,500 mark — which happens to be the Bitcoin resistance level that was in effect before the tariff selloff. However, readers should note that this is far from a foregone conclusion. Despite promising institutional adoption , roughly 25% of Bitcoin’s total supply is currently held at a loss . As positive as a retesting of Bitcoin resistance levels could be, it would also provide ample opportunity for risk-averse investors to liquidate their positions at a profit. Featured image via Shutterstock The post Why Bitcoin will retest resistance at $99,500 appeared first on Finbold . NewsBTC

On-Chain Finance’s Growth Depends on What You Can’t See
In the early days of blockchain, transparency was the movement’s rallying cry. Every transaction could be visible, every balance public and every action open to audit. This transparency helped DeFi stand apart from traditional finance (TradFi), where data is often inaccessible and decisions are made behind closed doors. However, as decentralized finance attempts to scale NewsBTC