1 days ago
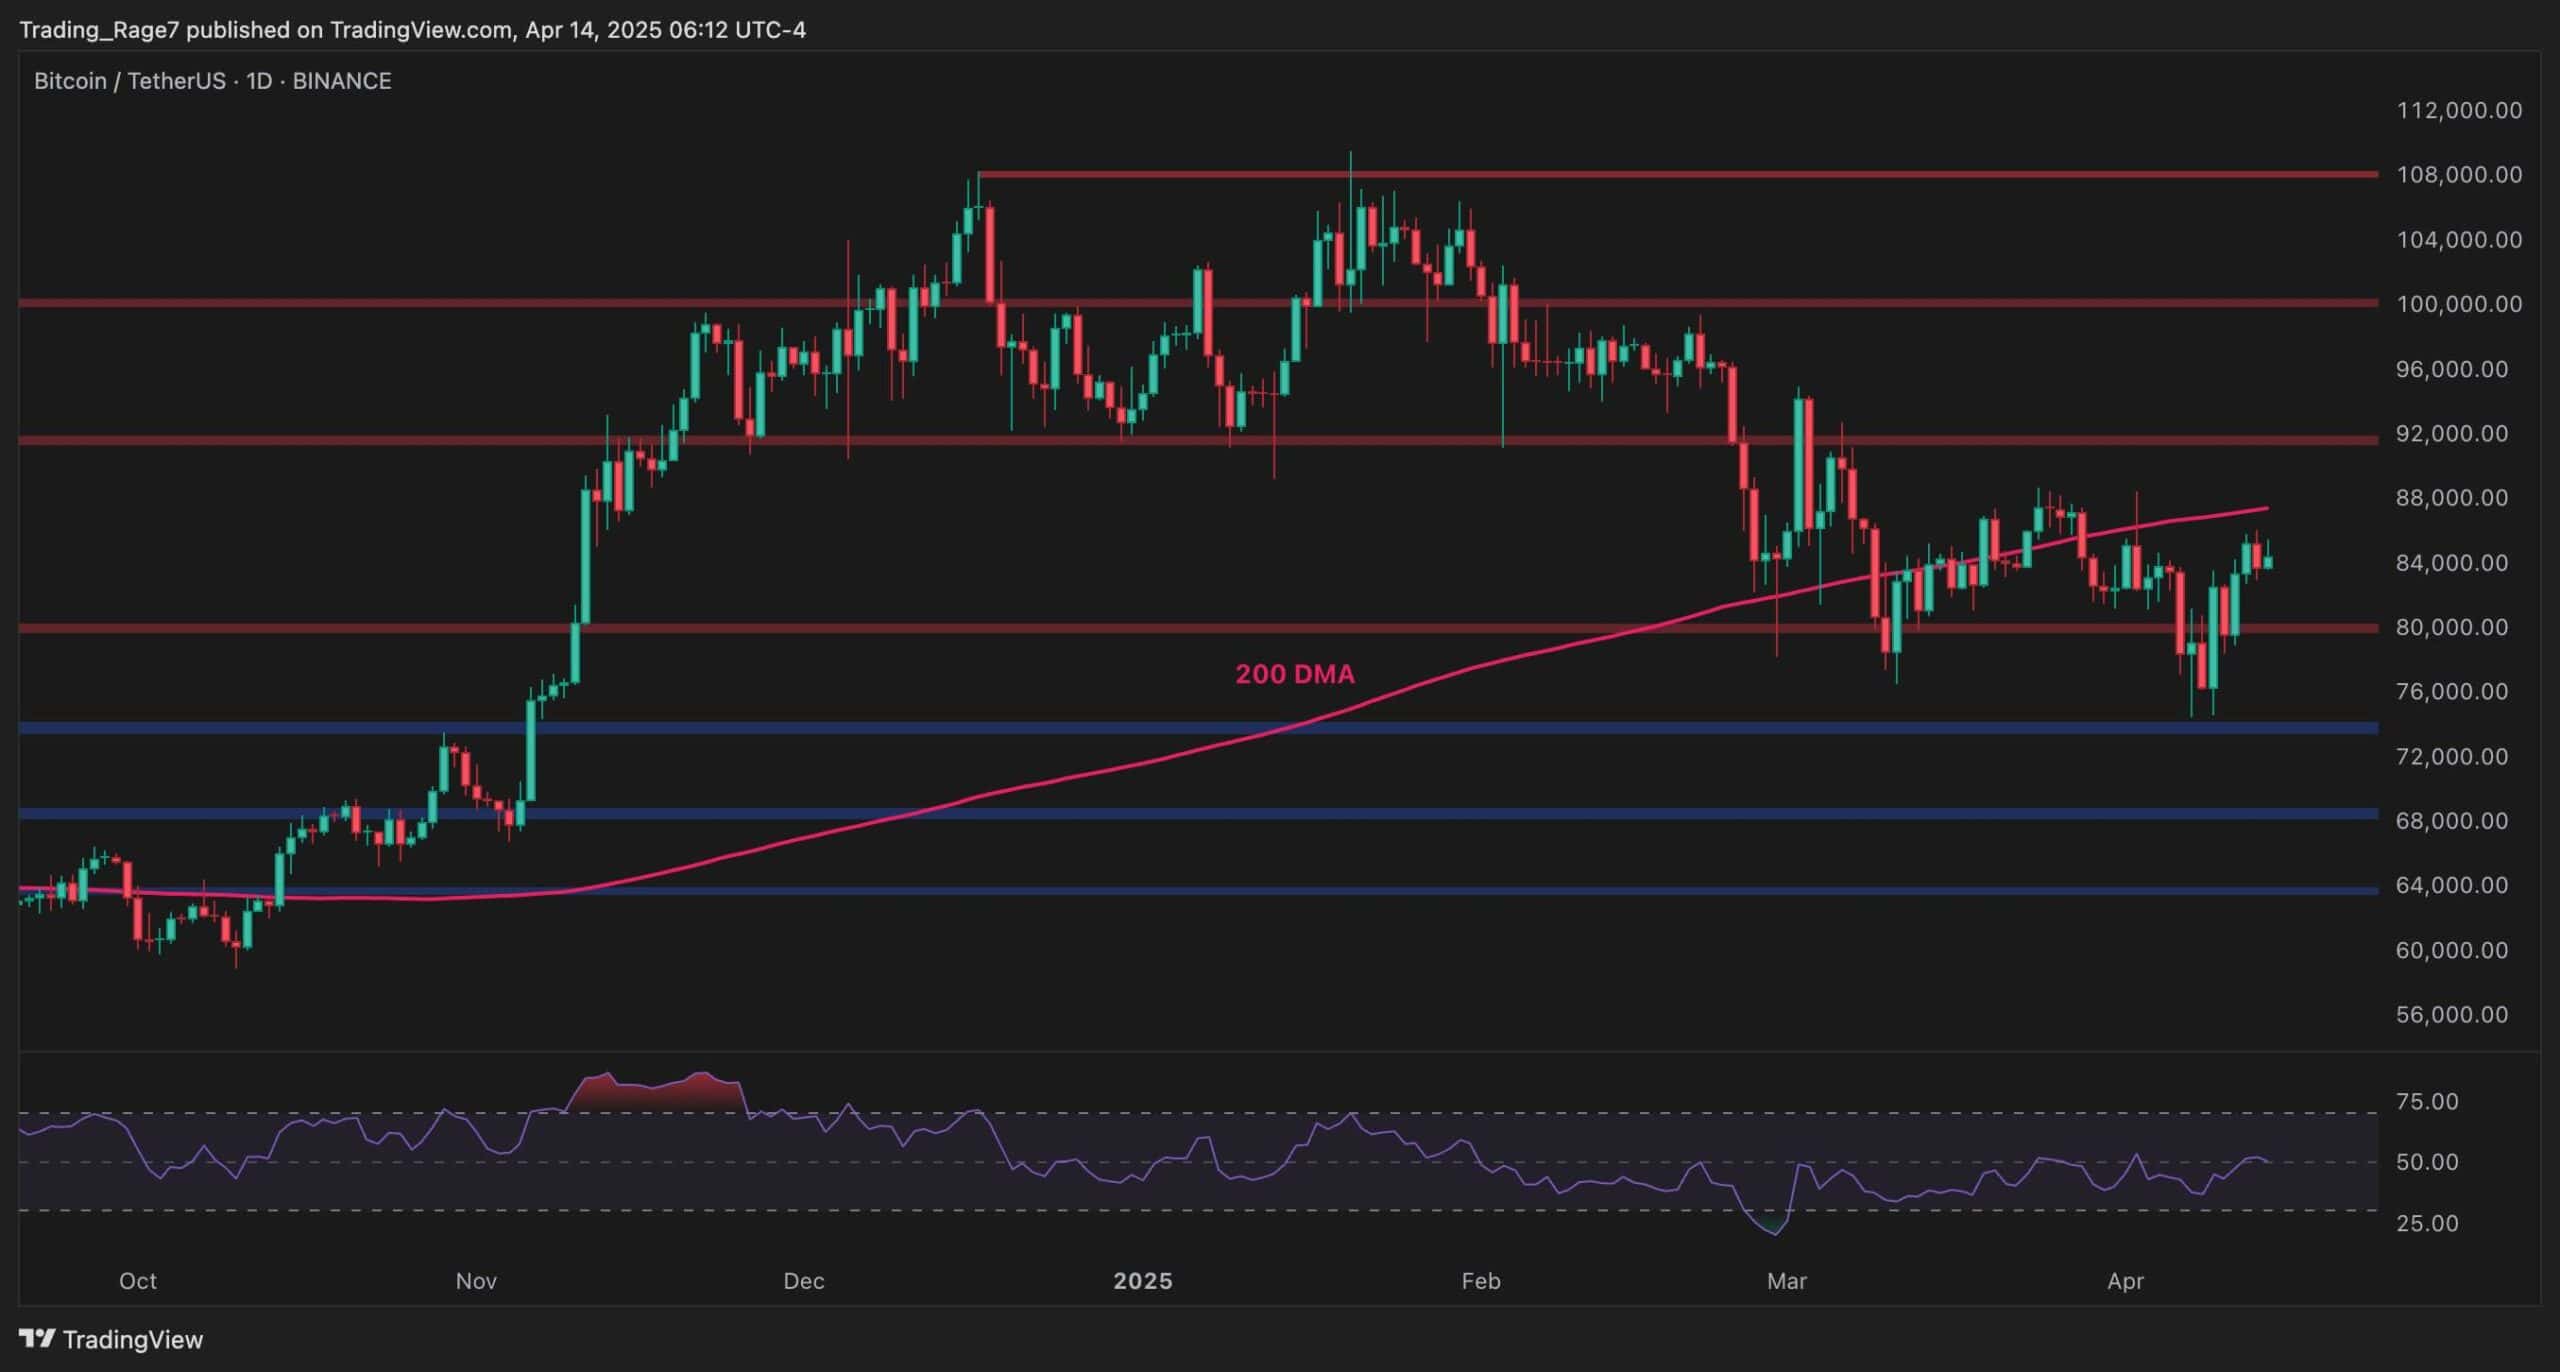
Bitcoin is slowly climbing its way back above key technical levels, but on-chain and price structure still hint at fragility beneath the surface. Here’s a breakdown of what’s going on with BTC from the daily and 4H chart perspectives, along with what exchange reserves are signaling. Technical Analysis By Edris Derakhshi The Daily Chart On the daily chart, BTC is trying to reclaim the 200-day moving average, located around the $88,000 level, to flip it into support. The price bounced strongly from the $75,000 demand zone and is currently grinding just below the $88,000 mark. While the recent move looks constructive, the structure remains range-bound, and RSI is mid-range around 50, showing neutral momentum. A clean breakout above $88,000 and the 200-day moving average with strong volume could open the door to $92K and beyond, but failure to push higher here may send the asset back toward the $80,000–$82,000 region for a retest. The 4-Hour Chart Zooming in, the 4H chart reveals a clean breakout above a long-standing descending trendline that capped the price for most of March and early April. After rebounding from the $75,000 support zone, BTC is now pushing higher and forming higher lows. Moreover, the RSI is holding above 50, suggesting buyers are in control in the short term. However, $86,000–$88,000 remains a major supply zone, and the buyers need to hold above the broken trendline to confirm strength. If that level is lost, this could easily turn into another fakeout and trap longs. On-Chain Analysis By Edris Derakhshi Exchange Reserve Bitcoin’s exchange reserves continue their relentless downtrend, now sitting at the lowest levels over the past few years. This steady outflow of BTC from centralized exchanges suggests a long-term accumulation trend, likely from large holders and institutions shifting bitcoins into cold storage. While declining reserves are generally bullish and reduce sell-side pressure, it also means that short-term volatility can be sharper due to thinner exchange liquidity. The latest drop aligns with the price recovering from the lows, hinting that some smart money may be loading up under $80K, but that thesis only holds if the asset continues to push higher and attract follow-through demand. The post Bitcoin’s 13% Weekly Rally Faces Resistance: Key Warning Signs to Watch (BTC Price Analysis) appeared first on CryptoPotato .
Crypto Potato
You can visit the page to read the article.
Source: Crypto Potato
Tags :
BTC Analysis BTCEUR BTCGBP BTCUSD BTCUSDT Crypto News Bitcoin (BTC) Price
Disclaimer: The opinion expressed here is not investment advice – it is provided for informational purposes only. It does not necessarily reflect the opinion of BitMaden. Every investment and all trading involves risk, so you should always perform your own research prior to making decisions. We do not recommend investing money you cannot afford to lose.
Crypto Needs Tools to ‘Demonstrate How Powerful Self-Custody Can Be’: WalletConnect Director

Former Kraken Chief Legal Officer Marco Santori talks global crypto regulation, privacy and his new role at WalletConnect. Crypto Potato

Bitcoin Rally Nears $90,000: Market Uncertainty About Sustainability and Future Gains
Bitcoin’s recent price surge has sparked renewed interest among traders, with speculations mounting about reaching the crucial $90,000 mark. Despite this bullish sentiment, market analysts are cautioning that without substantial Crypto Potato
See Also


BUSINESS


BUSINESS
-

Top Cardano (ADA) Price Predictions as of Late
13 dakika önce