1 days ago
A crypto strategist who accurately called Bitcoin’s collapse below $80,000 believes that BTC’s long-term uptrend will remain intact if it stays above a key price area. In a new strategy session, pseudonymous analyst Cheds tells his 49,800 YouTube subscribers that Bitcoin appears to have broken out of a W pattern on the four-hour chart. A W pattern is typically seen as a bullish reversal structure, as it suggests that an asset has printed a price floor after bouncing from a key support level twice. “We had a break of the W and then a throwback, a throwback being a bullish retest from above. This looks pretty conducive, and this type of price action tells me, ‘Okay, we might be front running $72,000.’ Giving me a little bit of a confidence was a shift in equities markets, and the idea that price was at the MA (moving average) 50, and that’s been support.” Cheds also says that Bitcoin will likely see higher prices as long as its immediate support level between $78,500 and $81,000 holds. “Regain $81,000 and we’re back in business… Back above $81,000, we’re back with the idea of regaining that low time frame pivot corresponding with the high time frame support at the MA50, and with the idea that the bulls are going to recapture the trend, which is the rising MA200.” Source: Cheds/X At time of writing, Bitcoin is trading at $85,301. Follow us on X , Facebook and Telegram Don`t Miss a Beat – Subscribe to get email alerts delivered directly to your inbox Check Price Action Surf The Daily Hodl Mix Disclaimer: Opinions expressed at The Daily Hodl are not investment advice. Investors should do their due diligence before making any high-risk investments in Bitcoin, cryptocurrency or digital assets. Please be advised that your transfers and trades are at your own risk, and any losses you may incur are your responsibility. The Daily Hodl does not recommend the buying or selling of any cryptocurrencies or digital assets, nor is The Daily Hodl an investment advisor. Please note that The Daily Hodl participates in affiliate marketing. Generated Image: Midjourney The post Crypto Analyst Says Bitcoin Back in Business, Calls for BTC Uptrend if One Support Level Holds appeared first on The Daily Hodl .
The Daily Hodl
You can visit the page to read the article.
Source: The Daily Hodl
Tags :
Bitcoin Trading BTC News trading
Disclaimer: The opinion expressed here is not investment advice – it is provided for informational purposes only. It does not necessarily reflect the opinion of BitMaden. Every investment and all trading involves risk, so you should always perform your own research prior to making decisions. We do not recommend investing money you cannot afford to lose.
Why Bitcoin will retest resistance at $99,500
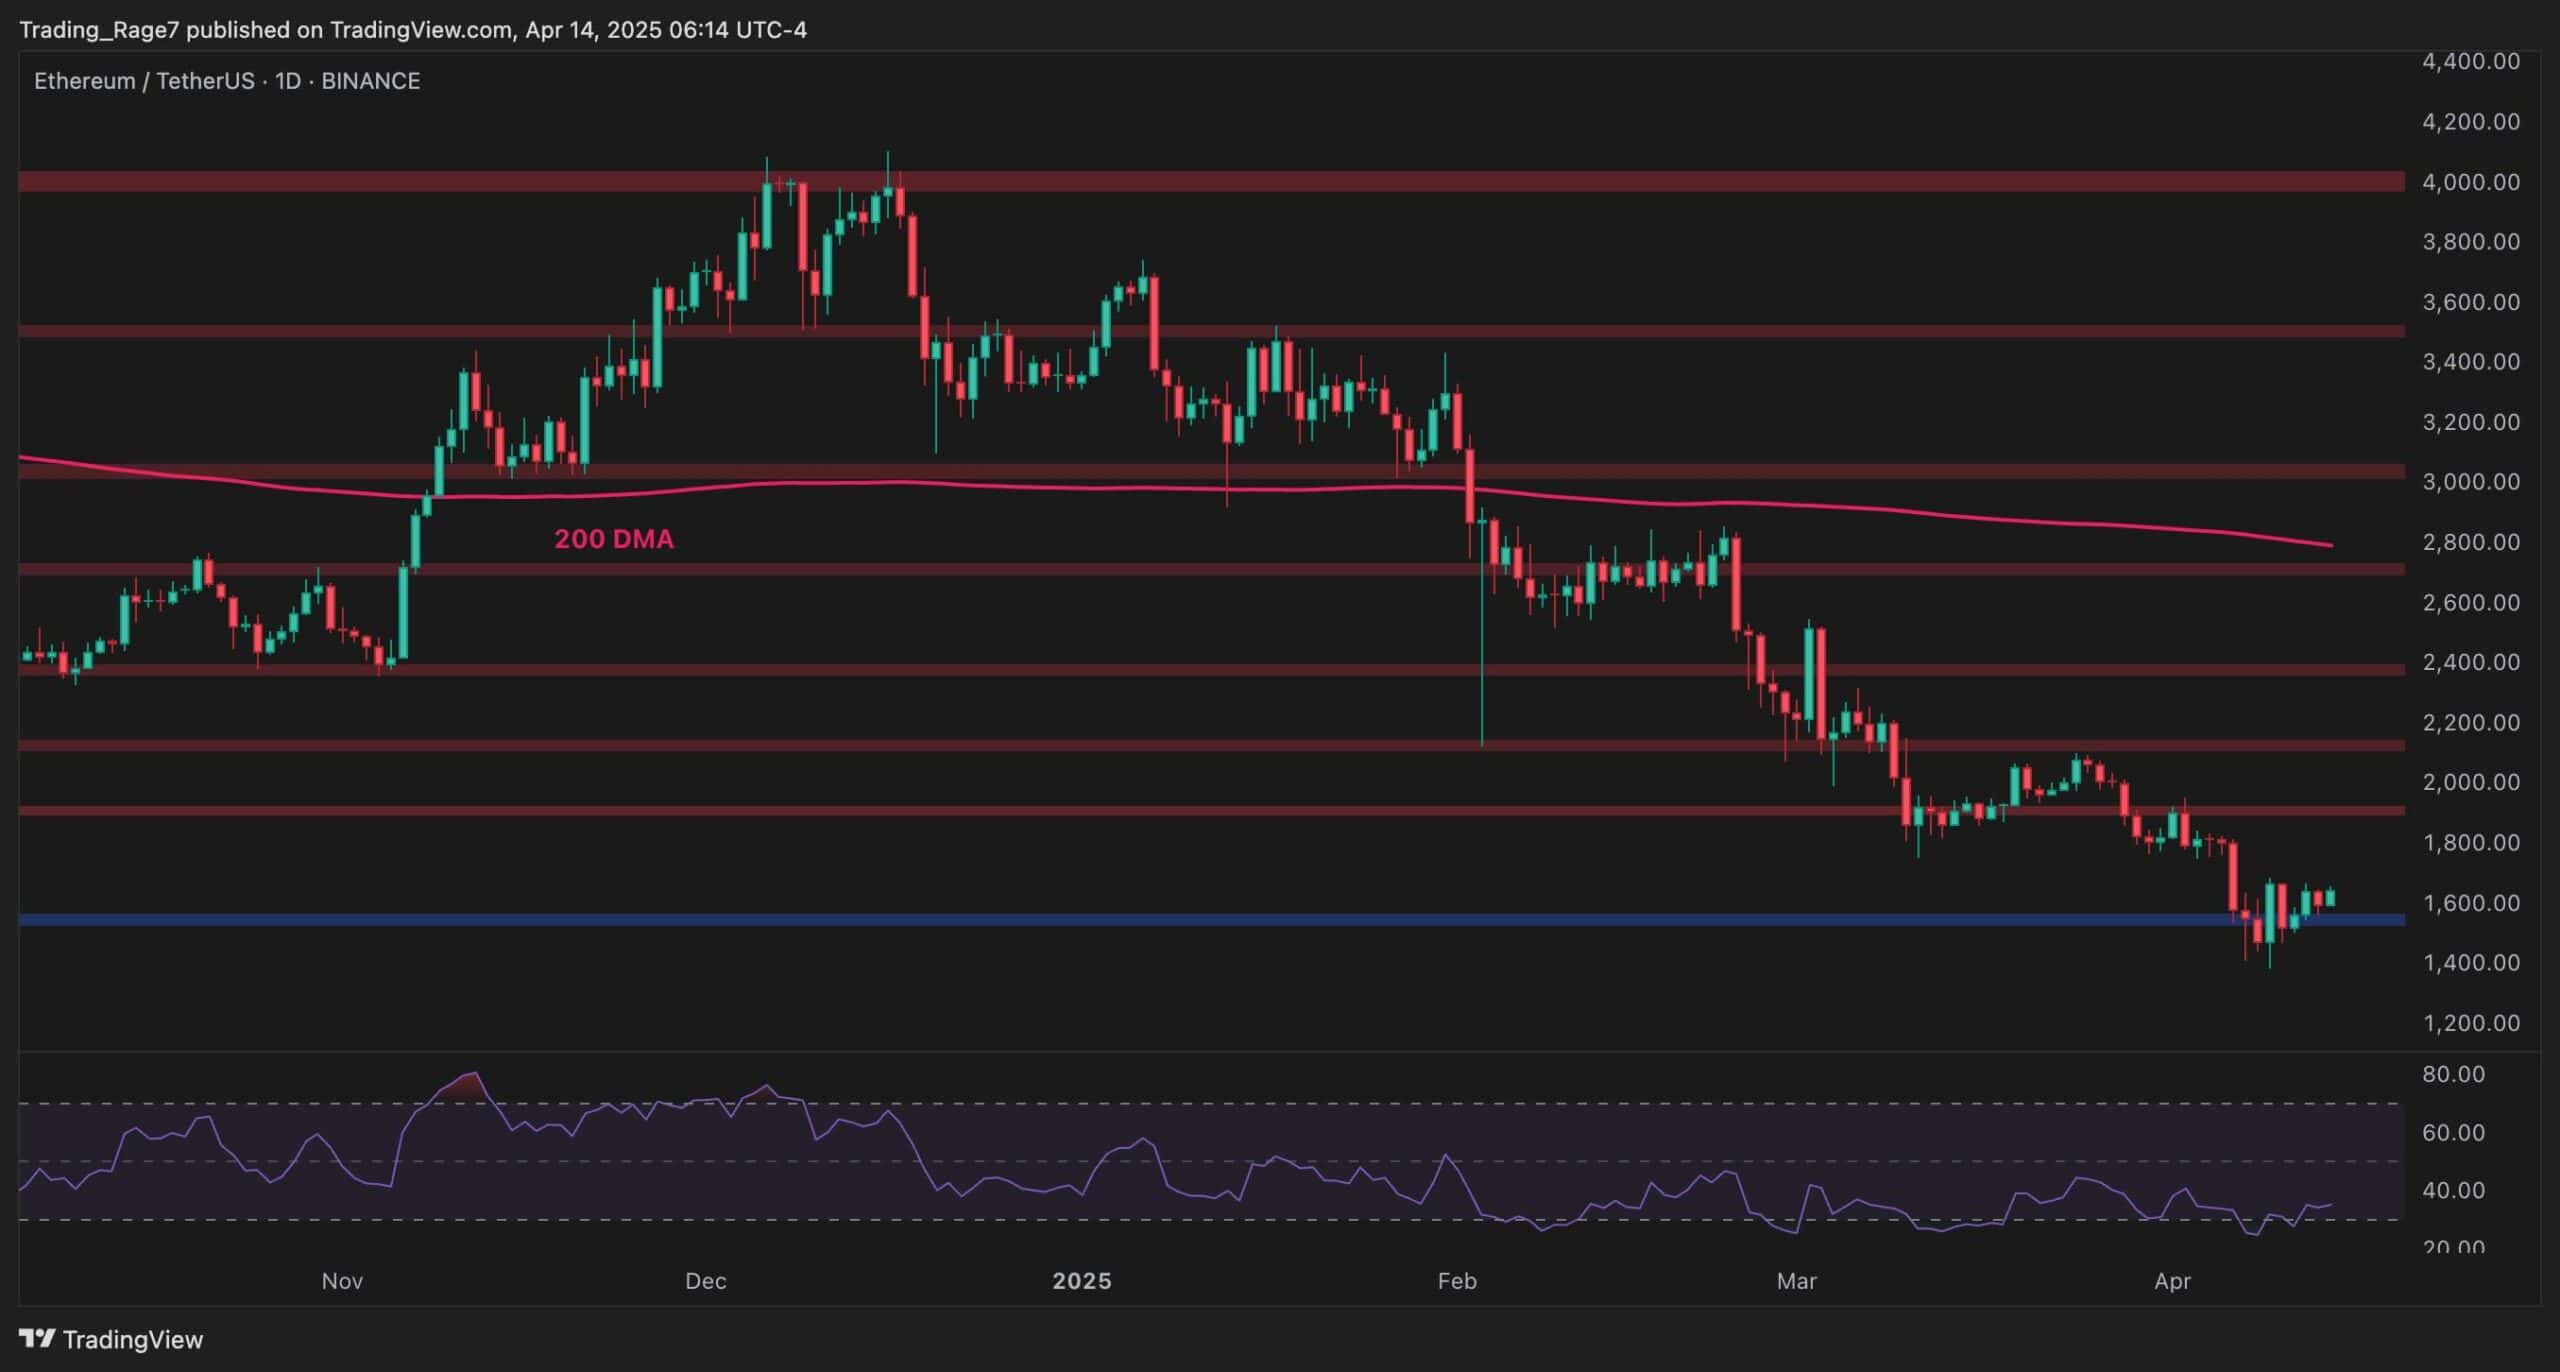
Technical analysis suggests that the leading digital asset could soon test levels close to the psychologically important $100,000 mark. The most important Bitcoin ( BTC ) resistance level currently sits at $99,500, and it held firm in the weeks preceding the tariff selloff. Despite having crashed below $80,000 in the aftermath of the tariff exchange, BTC prices recovered rather quickly. At press time, the leading cryptocurrency was changing hands at a price of $84,750, having rallied by 10.37% in the past seven days. BTC price 1-week chart. Source: Finbold As of the time of writing, Bitcoin is still down 9.38% since the year began. However, a surge to $99,500 would see it back in the green on a year-to-date (YTD) basis. Here’s why that is a distinct possibility. Bullish divergence suggests Bitcoin resistance will soon be retested Noted cryptocurrency technical analyst TradingShot outlined several arguments as to why a surge in BTC price could ensue in the immediate term in an April 14 TradingView post . For one, Saturday’s close on the daily chart is above the asset’s 50-day moving average ( MA ). This is the first time this has occurred since February 3. Up to this point, price had tested the MA 6 times, only to get rejected in each case. Moreover, recent price action has breached a trendline of lower highs charted since the January 20 all-time high (ATH) — if just barely. BTC price chart with technical analysis. Source: TradingShot on TradingView Lastly, all of this has happened in conjunction with Bitcoin marking lower lows in terms of prices, as well as lower highs in terms of its Relative Strength Index ( RSI ), indicating a bullish divergence that suggests the asset will not trend toward oversold levels going forward. In such instances, traders use a 2.0 Fibonacci extension level as a price target. This time around, it sits at the $99,500 mark — which happens to be the Bitcoin resistance level that was in effect before the tariff selloff. However, readers should note that this is far from a foregone conclusion. Despite promising institutional adoption , roughly 25% of Bitcoin’s total supply is currently held at a loss . As positive as a retesting of Bitcoin resistance levels could be, it would also provide ample opportunity for risk-averse investors to liquidate their positions at a profit. Featured image via Shutterstock The post Why Bitcoin will retest resistance at $99,500 appeared first on Finbold . The Daily Hodl
XRP price prediction made by top crypto expert
Despite the multiple positive regulatory developments, the economy-wide tariff shocks prevailed, sending XRP below its critical support levels near $2 and into an uncertain future. Fortunately for the token’s holders, it stabilized at approximately $1.75 and headed back into a rally that is now, according to an April 14 X post made by the prominent on-chain analyst Ali Martinez, on track to reclaim $2.40. Indeed, XRP is, at press time, within an ascending triangle and likely to enjoy a bullish breakout if it successfully breaches a strong resistance at $2.22. Currently trading at $2.16, XRP is only 2.78% away from testing the $2.22 resistance that could help it rally 11.11% and hit $2.40. XRP targeting a breakout near $2.22. Source: Ali Martinez Notably, the ascending triangle is a bullish breakout chart pattern that forms when an asset’s price crosses above its upper trendline accompanied by a rise in volume. How close is XRP to a breakout? Despite the recent crypto market turmoil that threatened to erase any hopes for a 2025 bull cycle, the token managed to climb 20.11% within the last seven days. XRP one-week price chart. SourceL Finbold Though the latest performance has been positive, it is worth remembering that XRP remains 34.74% below its $3.31 high on January 17 and is only up 2.81% in 2025. What’s next for XRP in 2025? Looking ahead, the token is facing a mix of bullish and bearish factors. To begin with, President Donald Trump’s tariff policy has been a major cause of turmoil for stocks , bonds , and cryptocurrencies alike, and recent developments promise more uncertainty ahead. Simultaneously, there has been a notable drop in regulatory pressure with the Securities and Exchange Commission (SEC) reaching an agreement with the XRP issuer Ripple Labs, the Internal Revenue Service (IRS) dropping its rules targeting digital assets, and the Department of Justice (DoJ) disbanding its cryptocurrency task force. Featured image via Shutterstock The post XRP price prediction made by top crypto expert appeared first on Finbold . The Daily Hodl