4 hours ago
XRP price started a fresh decline from the $3.00 resistance. The price is up down over 20% and might extend losses below the $2.20 support. XRP price started a fresh decline from the $3.00 zone. The price is now trading below $2.50 and the 100-hourly Simple Moving Average. There was a break below a connecting bullish trend line with support at $2.40 on the hourly chart of the XRP/USD pair (data source from Kraken). The pair might continue to move down if it breaks the $2.20 support zone. XRP Price Reverses XRP price rallied above the $2.50 and $2.80 levels before the bears appeared, like Bitcoin and Ethereum . The price failed to clear the $3.00 resistance and started a fresh decline. There was a sharp move below the $2.80 and $2.60 levels. The price traded below the 50% Fib retracement level of the upward move from the $1.95 swing low to the $3.00 high. There was also a break below a connecting bullish trend line with support at $2.40 on the hourly chart of the XRP/USD pair. The price is now trading below $2.40 and the 100-hourly Simple Moving Average. It is now finding bids just above the 76.4% Fib retracement level of the upward move from the $1.95 swing low to the $3.00 high. On the upside, the price might face resistance near the $2.35 level. The first major resistance is near the $2.40 level. The next resistance is $2.4750. A clear move above the $2.4750 resistance might send the price toward the $2.620 resistance. Any more gains might send the price toward the $2.700 resistance or even $2.750 in the near term. The next major hurdle for the bulls might be $2.80. More Losses? If XRP fails to clear the $2.40 resistance zone, it could start another decline. Initial support on the downside is near the $2.20 level. The next major support is near the $2.120 level. If there is a downside break and a close below the $2.120 level, the price might continue to decline toward the $2.050 support. The next major support sits near the $2.00 zone. Technical Indicators Hourly MACD – The MACD for XRP/USD is now gaining pace in the bearish zone. Hourly RSI (Relative Strength Index) – The RSI for XRP/USD is now below the 50 level. Major Support Levels – $2.20 and $2.120. Major Resistance Levels – $2.40 and $2.4750.
NewsBTC
You can visit the page to read the article.
Source: NewsBTC
Tags :
XRP Ripple XRPBTC XRPUSD xrpusdt
Disclaimer: The opinion expressed here is not investment advice – it is provided for informational purposes only. It does not necessarily reflect the opinion of BitMaden. Every investment and all trading involves risk, so you should always perform your own research prior to making decisions. We do not recommend investing money you cannot afford to lose.
Bybit CEO: 77% of Stolen Funds Still Traceable, 20% Untraceable, and 3% Frozen (Approximately $1.2B ETH Hack) ????Coin: ETH ( $ETH ) $2,094.17
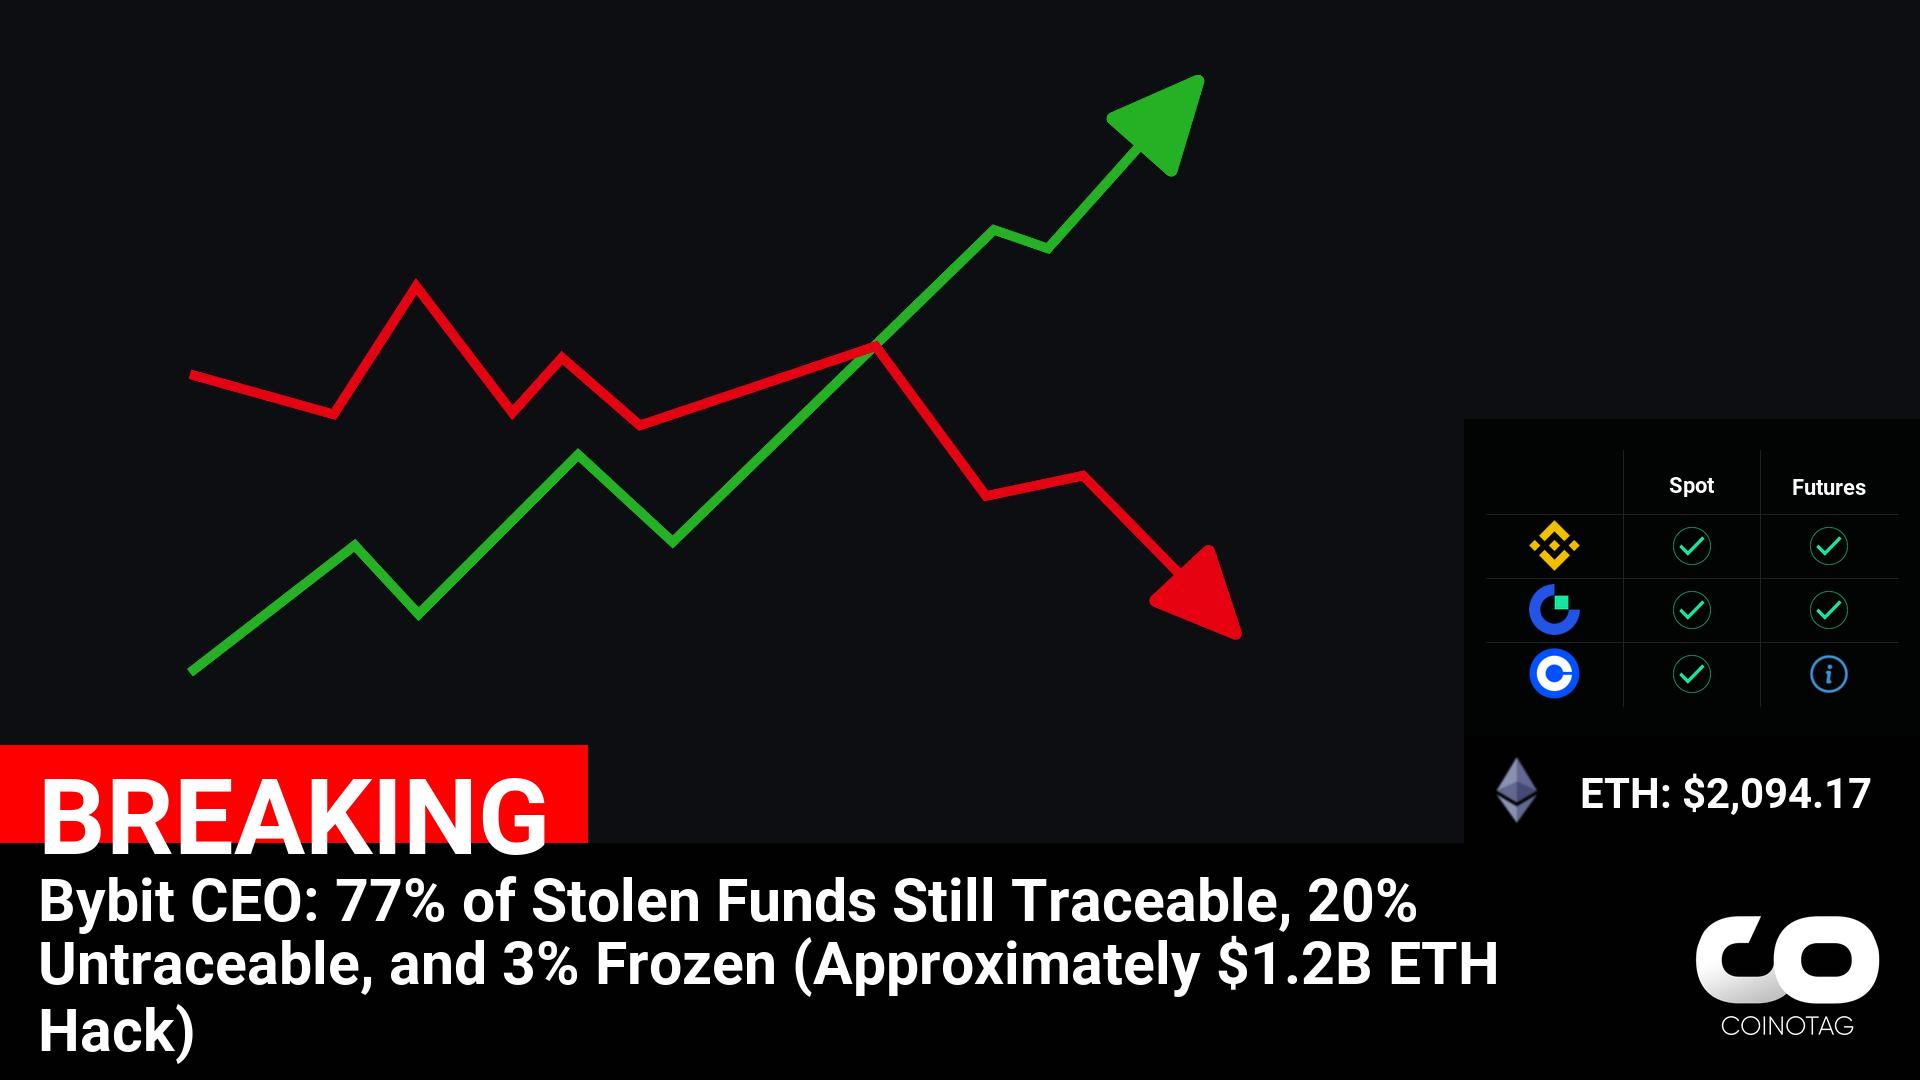
Bybit CEO: 77% of Stolen Funds Still Traceable, 20% Untraceable, and 3% Frozen (Approximately $1.2B ETH Hack) ????Coin: ETH ( $ETH ) $2,094.17 NewsBTC

Bitcoin Repeats Historic Pattern—Is a Breakout Toward $100K Next?
Bitcoin and the broader cryptocurrency market have shown strong recovery, with Bitcoin surpassing $93,000 earlier today after an increase of nearly 10% in the past 24 hours. The surge follows the announcement of a US crypto strategic reserve, which is expected to include major digital assets such as BTC, ETH, SOL, XRP, and ADA. The news has fueled optimism in the market, pushing Bitcoin back above the $90,000 level. As Bitcoin’s price movement gains momentum, analysts appear to have been closely examining the ongoing correction phase within the current bullish cycle. Related Reading: Bitcoin Reclaims Key Levels And Faces Resistance At $97K – Can It Break $100K This Week? CryptoQuant analyst Grizzly has shared insights into Bitcoin’s historical price behavior, suggesting that the asset may be repeating past patterns that preceded significant rallies. If these trends hold, BTC could be positioning itself for a major breakout in the coming months. BTC’s Historical Price Patterns and Market Outlook According to Grizzly, Bitcoin is currently in its third corrective phase within the bullish cycle that began in early 2023. This pattern has been observed using the UTXO Age Bands—a metric tracking how long BTC remains unmoved in wallets. Similar corrective phases took place in the summers of 2023 and 2024, each lasting around six months. During these periods, BTC experienced resistance before eventually breaking out into new price highs. Grizzly revealed that if this trend continues, BTC may remain in a consolidation phase for another two to three months, fluctuating between $80,000 and $100,000. A breakout beyond $100,000 could mark the end of the correction and potentially push BTC toward $130,000, as historical data suggests. The CryptoQuant analyst noted: Market participants should closely watch the structural dynamics of the premium bands, as a confirmed break above resistance could signal the next parabolic leg of Bitcoin’s bull market. Bitcoin’s Path to $100K: What Market Indicators Suggest Another CryptoQuant analyst, OnChainSchool, has provided further insights into BTC’s potential price movement beyond $100,000. The analyst highlights the MVRV Z-Score, a metric that tracks Bitcoin’s valuation in comparison to its historical fair value. According to the analyst. the current cooldown in the MVRV Z-Score indicates that Bitcoin could soon enter a rapid upward trajectory, similar to the price action observed in early 2024 when BTC surged past $72,000 to new all-time highs. However, unlike past cycles, the market appears to be moving at a faster pace, potentially influenced by the evolving political landscape in the US. Related Reading: Bitcoin Fills CME Gap Between $78,000 and $80,000 – Is A Reversal Around The Corner? With increasing attention on cryptocurrency from policymakers and institutional investors, there is a likelihood that BTC could break past its previous all-time high sooner than expected. Whether this acceleration will be sustained depends on multiple factors, including regulatory developments, macroeconomic conditions, and continued market demand for Bitcoin as a hedge asset. Featured image created with DALL-E, Chart from TradingView NewsBTC