8 hours ago
XRP price tested the $2.280 zone and recently corrected some losses. The price is now facing hurdles near the $2.50 and $2.60 levels. XRP price started a recovery wave from the $2.280 zone. The price is now trading above $2.40 and the 100-hourly Simple Moving Average. There was a break above a connecting bearish trend line with resistance at $2.450 on the hourly chart of the XRP/USD pair (data source from Kraken). The pair might start a fresh increase if it clears the $2.50 resistance zone. XRP Price Eyes Upside XRP price started a recovery wave from the $2.280 support zone, like Bitcoin and Ethereum . A base was formed and the price started an increase above the $2.32 and $2.35 levels. The bulls were able to push the price above the 23.6% Fib retracement level of the downward move from the $2.7849 swing high to the $2.2794 low. There was also a break above a connecting bearish trend line with resistance at $2.450 on the hourly chart of the XRP/USD pair. The price is now trading above $2.40 and the 100-hourly Simple Moving Average. On the upside, the price might face resistance near the $2.50 level. The first major resistance is near the $2.5320 level or the 50% Fib retracement level of the downward move from the $2.7849 swing high to the $2.2794 low. The next resistance is $2.60. A clear move above the $2.60 resistance might send the price toward the $2.720 resistance. Any more gains might send the price toward the $2.780 resistance or even $2.80 in the near term. The next major hurdle for the bulls might be $2.880. Another Decline? If XRP fails to clear the $2.50 resistance zone, it could start another decline. Initial support on the downside is near the $2.380 level or the 100-hourly Simple Moving Average. The next major support is near the $2.280 level. If there is a downside break and a close below the $2.280 level, the price might continue to decline toward the $2.140 support. The next major support sits near the $2.050 zone. Technical Indicators Hourly MACD – The MACD for XRP/USD is now losing pace in the bearish zone. Hourly RSI (Relative Strength Index) – The RSI for XRP/USD is now above the 50 level. Major Support Levels – $2.380 and $2.280. Major Resistance Levels – $2.50 and $2.60.
NewsBTC
You can visit the page to read the article.
Source: NewsBTC
Tags :
XRP Ripple XRPBTC XRPUSD xrpusdt
Disclaimer: The opinion expressed here is not investment advice – it is provided for informational purposes only. It does not necessarily reflect the opinion of BitMaden. Every investment and all trading involves risk, so you should always perform your own research prior to making decisions. We do not recommend investing money you cannot afford to lose.
Ethereum Price Gains Momentum as U.S. Retail Investors Drive Demand and Exchange Reserves Decline

Ethereum’s price has shown remarkable resilience, rebounding 2.87% to $2,718 amid increased demand from U.S. retail investors fueling bullish sentiment. The Market Value to Realized Value (MVRV) ratio suggests a NewsBTC
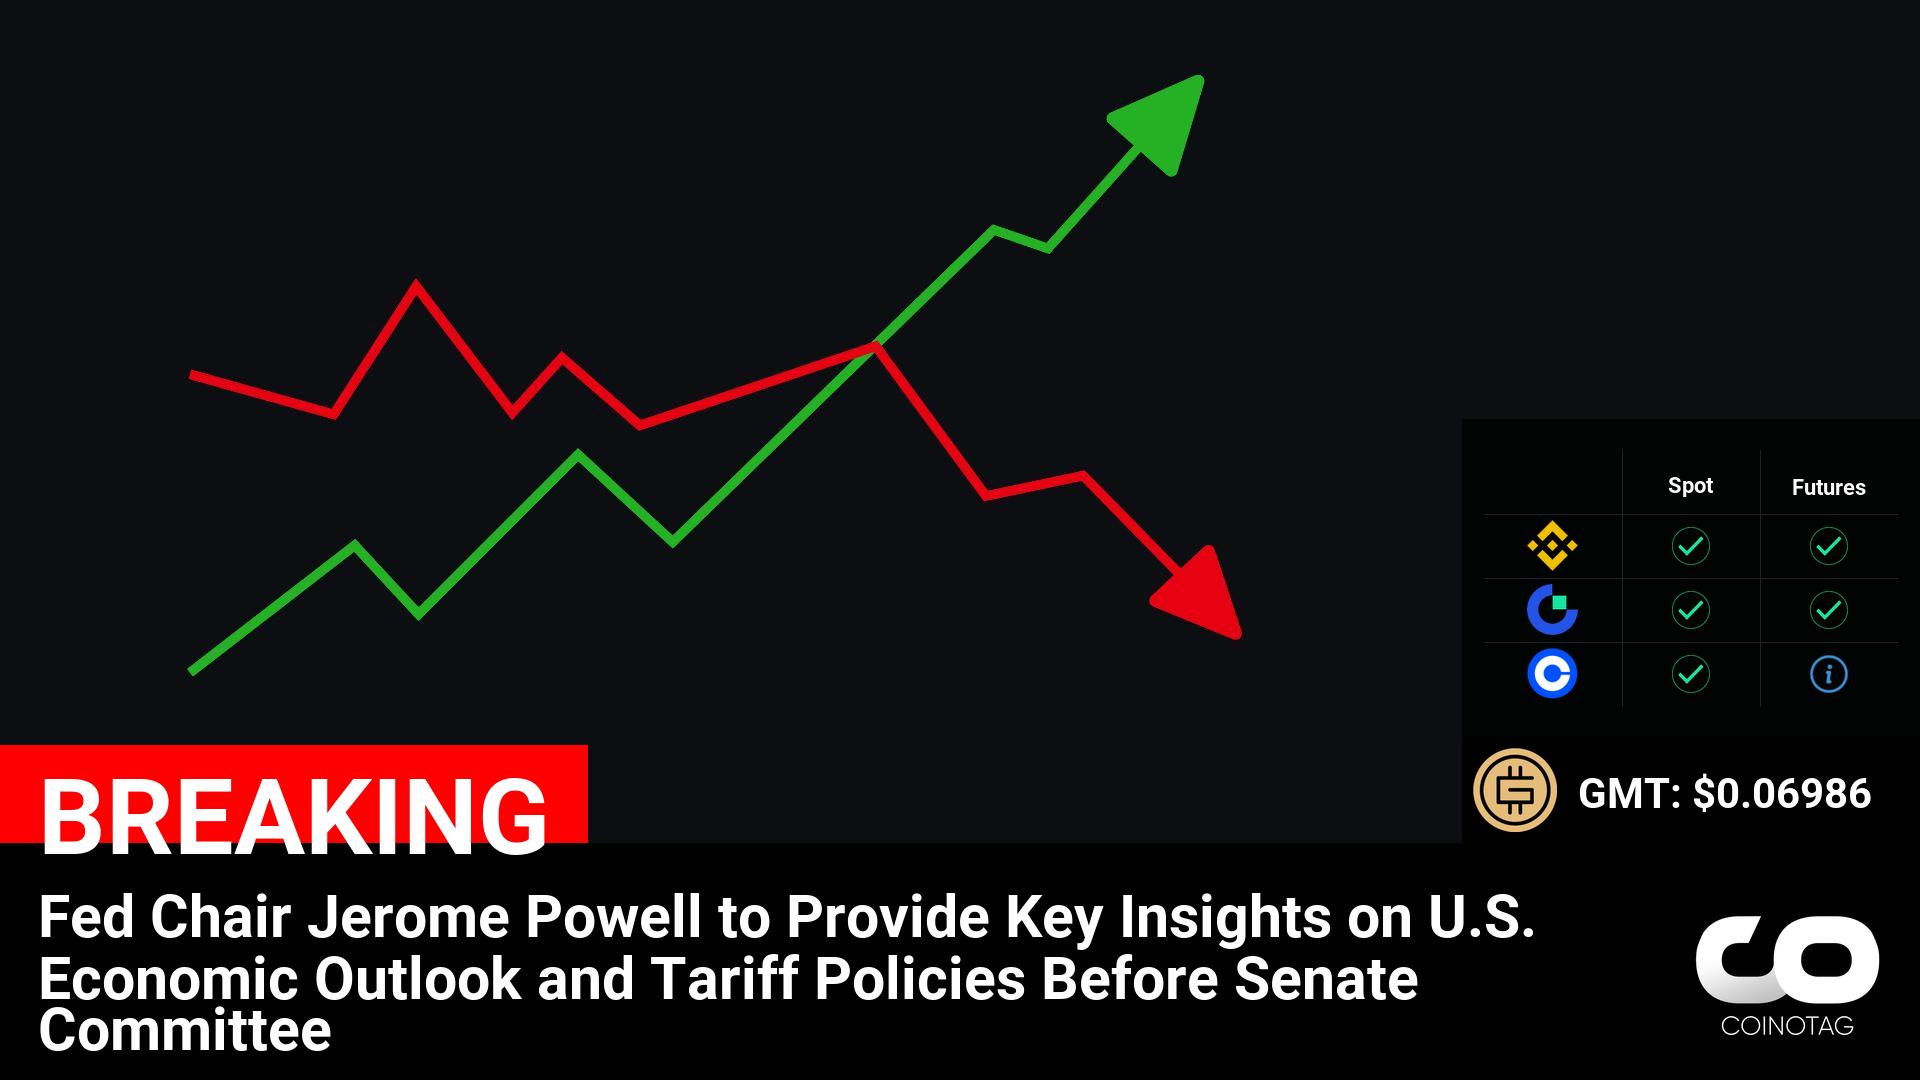
Fed Chair Jerome Powell’s Senate Testimony: Impact on US Economy and Tariff Policies – What It Means for Cryptocurrency Market and GMT Coin
Fed Chair Jerome Powell to Provide Key Insights on U.S. Economic Outlook and Tariff Policies Before Senate Committee ————— ????Coin: GMT ( $GMT ) $0.06986 ————— NFA. NewsBTC
See Also


51 dakika önce
Solana’s Rising Momentum Signals Promising Price Surge
BTC

TRADING
-

Binance and SEC Move to Halt Case, Find an Early Resolution
33 dakika önce