7 days ago
XRP is flashing a high-conviction bullish signal on the weekly chart, forming a well-defined falling wedge pattern, a historically reliable setup for explosive breakouts. After rallying from approximately $0.33 to $2.70, XRP entered a corrective consolidation, creating a sequence of lower highs and declining volume. This prolonged pullback has now morphed into a textbook wedge, nearing its apex. Falling wedges typically resolve to the upside—especially when combined with momentum resets—indicating XRP may be on the brink of a powerful move higher. Echoes of the 2024 Breakout Rally A striking parallel emerges when comparing the current setup to XRP’s pattern between July and October 2024. That falling wedge ended in a dramatic 700% breakout, with XRP vaulting from $0.33 to $2.70. The breakout aligned with a deep momentum oscillator bottom, signaling seller exhaustion and a macro reversal. Today’s chart shows nearly identical technical cues: the same wedge structure and a similar oscillator formation developing beneath the price action—suggesting history may be ready to repeat. Price Coils Toward Apex with Breakout Tension Building After topping above $3.50, XRP has formed a new falling wedge between approximately $3.50 and $2.00. The declining trendline features multiple rejections, while strong support holds firm—creating a tightening structure. As the price coils closer to the wedge’s apex, breakout probability increases. Wedges of this nature—especially after strong uptrends—often precede powerful rallies. If accompanied by a volume surge near the $3.50 resistance, a breakout confirmation could be imminent. Momentum Oscillator Confirms Bullish Shift The momentum oscillator beneath the chart strengthens the bullish case. Much like the 2024 breakout setup, the oscillator has double-bottomed near historical lows and is beginning to curl upward. This formation suggests that downward momentum is fading and that bullish strength is returning. When momentum shifts from deeply oversold regions alongside a tightening bullish price structure, it often signals the start of a macro-level rally. XRP appears to be in the early stages of such a move. We are on twitter, follow us to connect with us :- @TimesTabloid1 — TimesTabloid (@TimesTabloid1) July 15, 2023 Technical Projections Point to $5, $8, and Beyond Should XRP replicate its previous breakout magnitude, the upside potential is enormous. A 700% rally from current levels near $2.00 would project a target of $16.00, a bold but technically plausible move. More conservative projections include $5.00, $8.00, and $12.00, each lining up with major Fibonacci extension levels and psychological resistance zones. The key breakout threshold remains $3.50—a decisive weekly close above this level would confirm the pattern and likely ignite a bullish continuation. XRP Set for Parabolic Expansion Above $3.50 In conclusion, XRP is approaching a major inflection point . The high-time frame falling wedge pattern, now nearing completion, mirrors the structure that led to XRP’s last parabolic rally. Momentum indicators are also aligning, signaling a transition from weakness to strength. A breakout above $3.50 could be the trigger for a multi-month rally, propelling XRP toward $8.00–$16.00. For traders and investors, all eyes should remain on volume dynamics and weekly closes. If this setup unfolds as expected, XRP could reclaim its place as one of the top-performing assets in the crypto market. Disclaimer: This content is meant to inform and should not be considered financial advice. The views expressed in this article may include the author’s personal opinions and do not represent Times Tabloid’s opinion. Readers are urged to do in-depth research before making any investment decisions. Any action taken by the reader is strictly at their own risk. Times Tabloid is not responsible for any financial losses. Follow us on X , Facebook , Telegram , and Google News The post XRP Bullish Breakout Pattern Signals $16 Rally appeared first on Times Tabloid .
TimesTabloid
You can visit the page to read the article.
Source: TimesTabloid
Tags :
Cryptocurrency News Cryptocurrency Price Analysis XRP XRP Price Analysis XRP Price Prediction XRP. XRP Price
Disclaimer: The opinion expressed here is not investment advice – it is provided for informational purposes only. It does not necessarily reflect the opinion of BitMaden. Every investment and all trading involves risk, so you should always perform your own research prior to making decisions. We do not recommend investing money you cannot afford to lose.
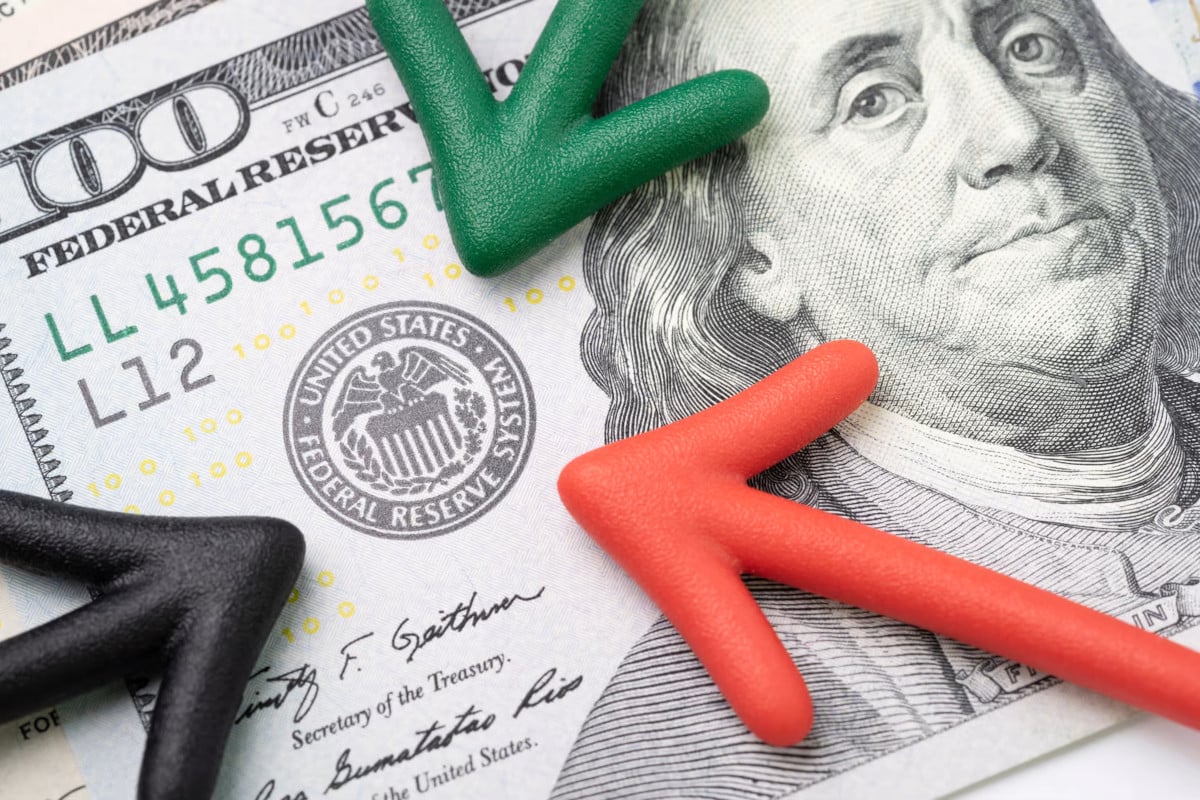
Crypto Market Slips Amid Fed Uncertainty and Trade Tensions

The cryptocurrency market remained volatile on Friday, as investor sentiment continued to dampen, following a week of tariff tensions and uncertainty surrounding the U.S. Federal Reserve’s next moves. Bitcoin (BTC) dropped 0.4% over the past 24 hours, trading at around $84,450, while Ethereum (ETH) remained similarly flat on the day, trading at $1,585. Meanwhile, XRP and SOL both decreased by a mild 1% and are currently trading at $2.06 and $133, respectively. The total cryptocurrency market capitalization fell by 1.7% on the day to $2.75 trillion, according to CoinGecko . Over the past 24 hours, leveraged liquidations reached $92.44 million, per data from CoinGlass . Bitcoin accounted for $15 million, followed by Ethereum with approximately $14 million. Altcoins made up around $12 million in liquidations. To continue reading this as well as other DeFi and Web3 news, visit us at thedefiant.io TimesTabloid

Get Ready for ADA Coin’s Potential Surge as BTC Stabilizes
ADA Coin shows potential for a 30% price increase according to Ali Martinez. Bitcoin is maintaining a stable price, giving rise to optimism in the market. Continue Reading: Get Ready for ADA Coin’s Potential Surge as BTC Stabilizes The post Get Ready for ADA Coin’s Potential Surge as BTC Stabilizes appeared first on COINTURK NEWS . TimesTabloid
See Also


ALTCOIN


ALTCOIN
-

Pi Network News Today: April 18th
2 saat önce