13 hours ago
A cryptocurrency trader reportedly earned over $1.6 million in profits by taking a highly leveraged 50x long position on bitcoin (BTC) and ethereum (ETH) before President Donald Trump’s announcement of a proposed U.S. crypto strategic reserve on March 2, 2025. High-Risk Bet Pays Off: Trader Gains $1.6M on Bitcoin and Ethereum Post-Policy Shift Trump’s announcement,
Bitcoin.com
You can visit the page to read the article.
Source: Bitcoin.com
Tags :
Crypto News Bitcoin (BTC) Donald Trump Ethereum (ETH)
Disclaimer: The opinion expressed here is not investment advice – it is provided for informational purposes only. It does not necessarily reflect the opinion of BitMaden. Every investment and all trading involves risk, so you should always perform your own research prior to making decisions. We do not recommend investing money you cannot afford to lose.
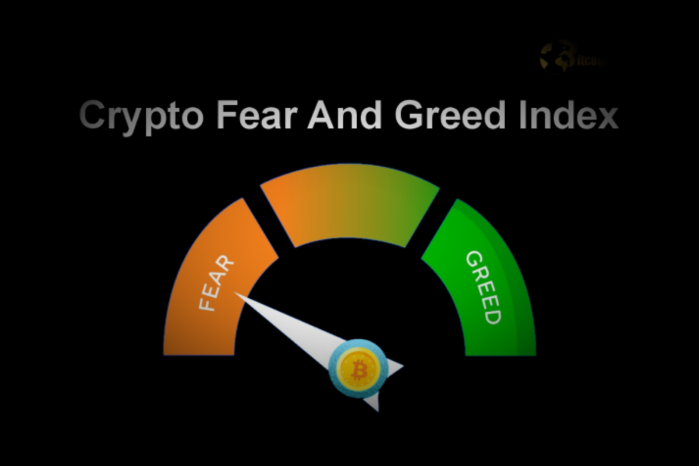
Decoding Crypto Fear & Greed Index: Hopeful Signs Emerge as Sentiment Improves
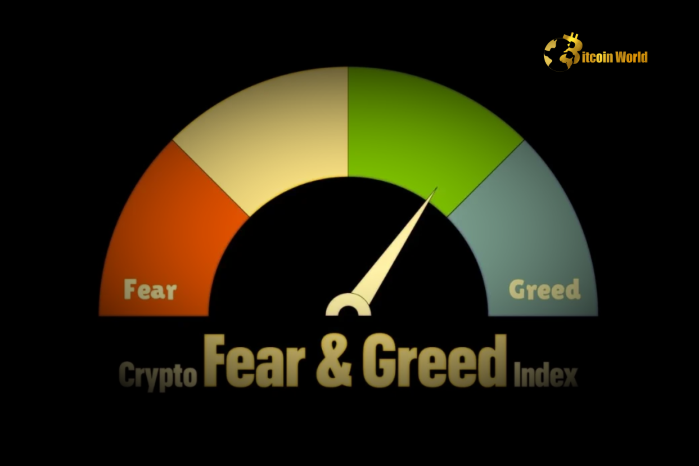
Navigating the volatile world of cryptocurrency requires more than just technical analysis and market charts. Understanding market sentiment, the overall mood or attitude of investors towards the crypto market, can be a crucial tool in your investment arsenal. One of the most popular tools for gauging this sentiment is the Crypto Fear & Greed Index . Let’s delve into the latest readings and what they might signify for your crypto strategy. Decoding the Crypto Fear & Greed Index: A Beacon of Market Sentiment The Crypto Fear & Greed Index , provided by Alternative.me, is a composite metric designed to reflect the emotional temperature of the cryptocurrency market. Think of it as a mood ring for crypto investors. It aggregates various data points to distill market sentiment into a single, easy-to-understand number ranging from 0 to 100. Here’s a simple breakdown: 0-24: Extreme Fear – This zone typically suggests investors are excessively worried, often indicating a potential buying opportunity as assets may be undervalued. 25-49: Fear – Still in bearish territory, signaling caution and potential market downturns. 50-74: Greed – Indicates growing optimism, where investors are becoming more bullish. 75-100: Extreme Greed – A zone of exuberance, often a warning sign of a potential market bubble and impending correction. As of March 3rd, the index stands at 33, a seven-point jump from the previous day. While this rise indicates improved crypto market sentiment , it’s crucial to note that the index remains in the “Fear” zone. This suggests that while the extreme pessimism might be receding, caution is still the prevailing sentiment among crypto investors. Unpacking the Factors: What Drives the Fear & Greed Index? The Fear and Greed Index isn’t just a random number; it’s calculated based on a weighted average of six different market factors. Understanding these components provides deeper insights into what’s influencing market emotions: Volatility (25%) : Measures the current and maximum drawdowns of Bitcoin, comparing it with the average values over the last 30 and 90 days. Unusually high volatility often signals fear. Market Momentum/Volume (25%) : Compares current market momentum and volume to the 30 and 90-day averages. High buying volume indicates greed, while low volume during price drops can signify fear. Social Media (15%) : Primarily analyzes sentiment on platforms like Twitter and Reddit, tracking hashtags and engagement related to Bitcoin and other cryptocurrencies to gauge public opinion. Surveys (15%) : Weekly crypto surveys gather insights directly from investors to understand their current sentiment. (Note: This factor is currently paused as per Alternative.me) Bitcoin Dominance (10%) : Measures Bitcoin’s share of the total crypto market cap. Increased Bitcoin dominance can sometimes suggest a ‘flight to safety’ during fearful times, while a decrease might indicate higher risk appetite and greed. Google Trends (10%) : Analyzes Google search queries related to Bitcoin and crypto terms. A spike in searches like “Bitcoin price prediction” or “buy Bitcoin” can indicate growing interest and potentially greed, while searches related to crashes might suggest fear. Why Does Market Sentiment Matter in Crypto? The cryptocurrency market is known for its high volatility and sensitivity to news and events. Emotional reactions can often amplify price swings, creating opportunities and risks alike. Here’s why tracking crypto market sentiment is beneficial: Identify Potential Buying Opportunities : Extreme fear can drive prices down to undervalued levels. Savvy investors often see this as a chance to buy low, anticipating a market recovery. Recognize Potential Selling Signals : Extreme greed can inflate asset prices beyond sustainable levels, potentially leading to market corrections. Recognizing this exuberance can help investors take profits before a downturn. Understand Market Psychology : The index provides a snapshot of the collective emotional state of the market, helping you understand the prevailing mood and make more informed decisions, less driven by your own emotions. Complement Technical and Fundamental Analysis : Sentiment analysis should be used in conjunction with other forms of market analysis. It adds a layer of psychological understanding to your overall investment strategy. Navigating the ‘Fear’ Zone: Actionable Insights The current reading of 33, while improved, still places us in the ‘Fear’ zone. What does this mean for crypto investors? Remain Cautious but Alert : Fear in the market suggests potential downward pressure, but also opportunities. It’s not a time for reckless buying or panic selling. Review Your Portfolio : Assess your risk tolerance and portfolio allocation. Ensure you are comfortable with your positions if the market experiences further volatility. Look for Value : Fear can create buying opportunities for fundamentally strong projects that might be temporarily undervalued. Conduct thorough research before making any investment decisions. Stay Informed : Keep tracking the Crypto Fear & Greed Index and other market indicators. Sentiment can shift quickly, and staying informed is key to navigating the crypto landscape. The Road Ahead: Will Sentiment Continue to Improve? The slight uptick in the Crypto Fear and Greed Index is a welcome sign for crypto enthusiasts. Whether this marks the beginning of a sustained shift towards less fearful sentiment remains to be seen. Several factors could influence future readings, including: Macroeconomic Events : Global economic conditions, inflation rates, and interest rate decisions by central banks significantly impact the crypto market. Regulatory Developments : Clarity or uncertainty in crypto regulations can heavily influence investor sentiment. Technological Advancements and Adoption : Positive developments in blockchain technology and increasing adoption of cryptocurrencies can boost market confidence. Black Swan Events : Unexpected events, both positive and negative, can trigger rapid shifts in market sentiment. Keeping an eye on the Bitcoin sentiment and the broader crypto analysis landscape is crucial. The Fear & Greed Index is a valuable tool, but it’s just one piece of the puzzle. Combine it with your own research and risk assessment to make informed decisions in the exciting yet unpredictable world of cryptocurrency. Conclusion: Emotions and Opportunities in Crypto The Crypto Fear & Greed Index serves as a powerful reminder that emotions play a significant role in the cryptocurrency market. While currently in the ‘Fear’ zone, the recent improvement offers a glimmer of hope. By understanding and monitoring market sentiment alongside fundamental and technical analysis, investors can better navigate volatility, identify potential opportunities, and make more rational decisions in this dynamic asset class. Remember, informed decisions, not emotional reactions, are the cornerstone of successful crypto investing. To learn more about the latest crypto market trends, explore our article on key developments shaping Bitcoin price action. Bitcoin.com
Decoding the Crypto Market: Altcoin Season Index Signals Critical Bitcoin Season
Is the crypto market buzzing with altcoin fervor or is Bitcoin reigning supreme? For crypto enthusiasts and investors, understanding market cycles is crucial. The CoinMarketCap (CMC) Altcoin Season Index provides a fascinating glimpse into this dynamic, and the latest reading points towards a clear trend: we’re currently navigating a Bitcoin Season . Decoding the Altcoin Season Index: What Does 14 Really Mean? The Altcoin Season Index , a tool meticulously tracked by CoinMarketCap, offers a numerical representation of the prevailing market sentiment. As of 00:35 UTC on March 3rd, the index registered a score of 14, holding steady from the previous day. But what exactly does this seemingly low number signify? In essence, a score of 14 firmly places us in Bitcoin Season . Let’s break down how this index works: Scope: The index analyzes the top 100 cryptocurrencies listed on CMC, excluding stablecoins and wrapped tokens to provide a pure reflection of market dynamics. Performance Window: It assesses the performance of these altcoins against Bitcoin over the past 90 days. This 90-day window offers a significant timeframe to gauge market trends, smoothing out short-term volatility. The 75% Threshold: The core principle of the index revolves around a 75% benchmark. Altcoin Season: If 75% or more of the top 100 altcoins outperform Bitcoin in the last 90 days, the market is considered to be in ‘Altcoin Season’. Bitcoin Season: Conversely, if 75% or more of these altcoins *underperform* Bitcoin (meaning 25% or fewer outperform), we are in ‘Bitcoin Season’. Index Range: The Altcoin Season Index score ranges from 1 to 100, providing a granular view of the market’s lean towards either Bitcoin or altcoins. A lower score, like 14, indicates a stronger Bitcoin dominance. Why Does the Altcoin Season Index Matter for Crypto Investors? Understanding whether we’re in Bitcoin Season or Altcoin Season is more than just market trivia; it’s a critical piece of information for strategic crypto investing. Here’s why: Portfolio Allocation: Knowing the prevailing market season can guide your portfolio adjustments. During Bitcoin Season , it might be prudent to increase your Bitcoin holdings or focus on Bitcoin-related investments. In contrast, Altcoin Season might present opportunities to diversify into select altcoins showing strong momentum. Risk Management: Altcoins are generally considered riskier than Bitcoin due to their higher volatility and smaller market capitalization. A Bitcoin Season often signals a flight to safety, suggesting potentially higher risk in holding a large altcoin portfolio. Trading Strategies: Traders can tailor their strategies based on the season. Bitcoin Season might favor Bitcoin-focused trading pairs, while Altcoin Season could open up opportunities in altcoin-to-Bitcoin or altcoin-to-fiat pairs. Market Sentiment Analysis: The Altcoin Season Index serves as a broader indicator of market sentiment. A strong Bitcoin Season might reflect investor caution or a belief in Bitcoin’s continued dominance as a store of value. Navigating the Current Bitcoin Season: What’s Driving It? With the Altcoin Season Index firmly in Bitcoin territory, it’s natural to wonder what factors are contributing to this market phase. While pinpointing exact causes is complex, several potential drivers could be at play: Macroeconomic Uncertainty: Global economic conditions, inflation concerns, and geopolitical events often drive investors towards perceived safe-haven assets. In the crypto world, Bitcoin is frequently viewed as the safest bet amidst broader market uncertainty. Institutional Investment Flow: Large institutional investors often favor Bitcoin due to its established track record, regulatory clarity (relative to altcoins), and deeper liquidity. Increased institutional inflows into Bitcoin can strengthen its dominance. Bitcoin Narrative Strength: Positive narratives around Bitcoin, such as its role as digital gold, inflation hedge, or store of value, can bolster its appeal and lead to outperformance against altcoins. Developments like ETF approvals or positive regulatory updates can further strengthen this narrative. Altcoin Market Corrections: After periods of significant altcoin rallies, corrections are natural. Profit-taking in altcoins and a rotation back to Bitcoin can contribute to a Bitcoin Season. Actionable Insights for a Bitcoin Season: Strategies to Consider So, how should crypto investors and traders navigate the current Bitcoin Season ? Here are some actionable insights: Re-evaluate Portfolio Allocation: Assess your current crypto portfolio. Is it heavily weighted in altcoins? Consider rebalancing to increase your Bitcoin allocation if you anticipate the Bitcoin Season to persist. Focus on Bitcoin Trading Pairs: For active traders, exploring Bitcoin trading pairs (e.g., BTC/USD, BTC/ETH) might offer more consistent opportunities during a Bitcoin Season. Research Resilient Altcoins: Not all altcoins underperform during Bitcoin Season. Identify altcoins with strong fundamentals, active development, and growing adoption that might weather the Bitcoin dominance and potentially outperform when market sentiment shifts. Dollar-Cost Averaging (DCA) into Bitcoin: If you believe in the long-term potential of Bitcoin, a Bitcoin Season can be an opportune time to accumulate more Bitcoin through DCA strategies. Stay Informed and Adaptable: The crypto market is incredibly dynamic. Continuously monitor the Altcoin Season Index , market news, and fundamental developments to adapt your strategies as market conditions evolve. Challenges and Considerations When Using the Altcoin Season Index While the Altcoin Season Index is a valuable tool, it’s essential to acknowledge its limitations and use it as one data point among many: Lagging Indicator: The index is based on 90-day performance, meaning it reflects past market movements. It’s not a predictive tool for future market direction. Top 100 Focus: The index only considers the top 100 coins. Performance outside this range is not captured, potentially missing emerging altcoin trends. Market Manipulation: Like any metric, the index can be influenced by market manipulation, although the 90-day window and broad scope mitigate this risk to some extent. Oversimplification: Reducing market dynamics to a single index score is an oversimplification. It’s crucial to consider other factors like market volume, news events, and on-chain metrics alongside the Altcoin Season Index . Conclusion: Embracing the Bitcoin Season and Preparing for What’s Next The Altcoin Season Index at 14 clearly signals that we are currently in a Bitcoin Season . This isn’t necessarily a bearish signal for the broader crypto market, but rather a reflection of current market dynamics where Bitcoin is leading the charge. By understanding the nuances of this index, recognizing the factors driving market seasons, and adopting adaptable strategies, crypto investors can navigate these phases effectively. The key is to stay informed, remain agile, and remember that the crypto market is cyclical – seasons change, and opportunities emerge in every phase. To learn more about the latest crypto market analysis trends, explore our article on key developments shaping Bitcoin price action . Bitcoin.com


FIAT
-
Trump’s Strategic Crypto Reserve Sparks XRP Surge
52 dakika önce -
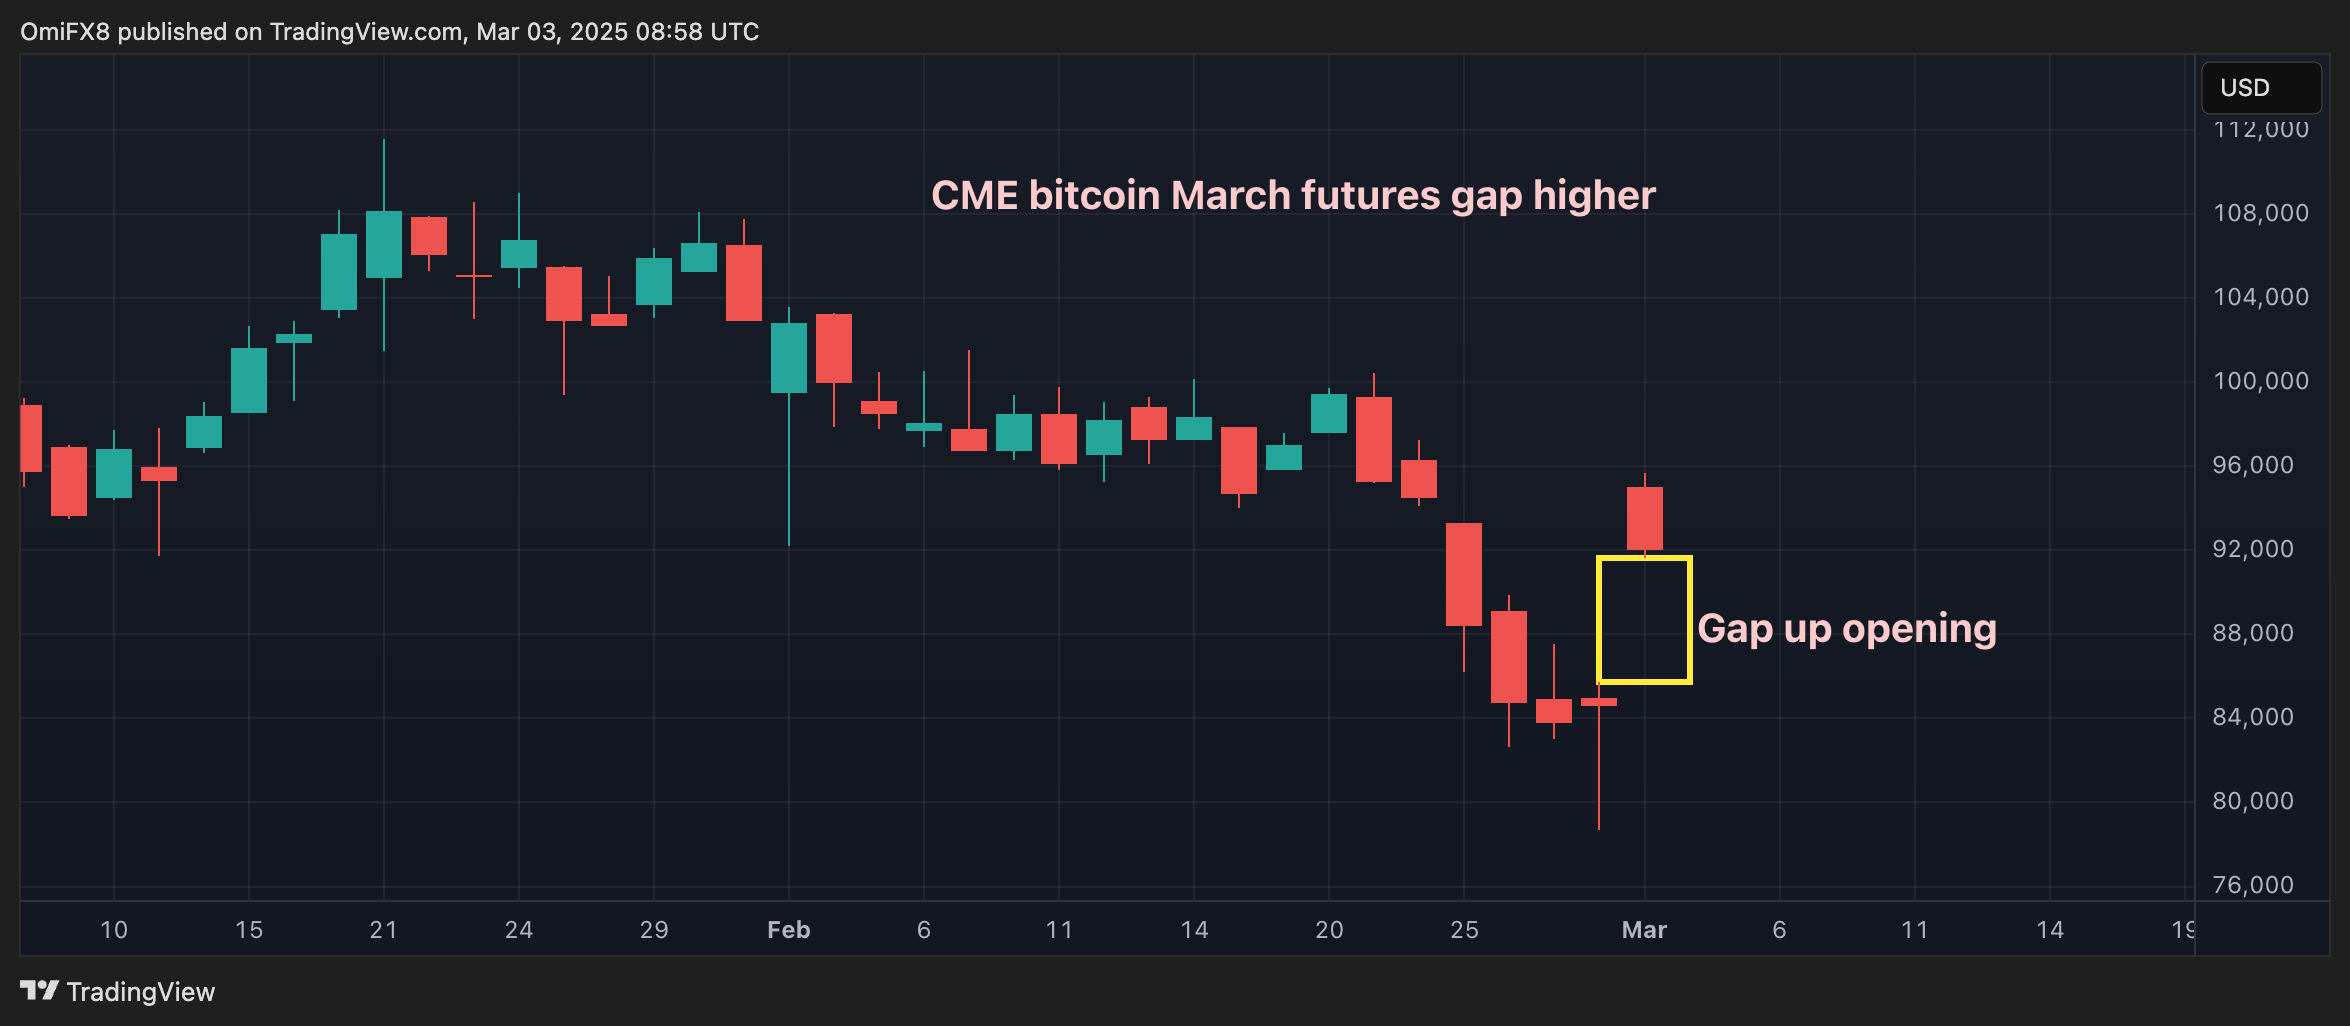
CME Bitcoin March Futures Gap Jumps By Over $9K
25 dakika önce