233 days ago
Request Network introduces a groundbreaking decentralized payment protocol aimed at making financial transactions more transparent, traceable, and cost-effective. The platform’s native token, REQ Coin, plays a crucial role within the ecosystem, supporting various functionalities and use cases. A prominent quote by Request Network’s CEO emphasizes their mission: “We are redefining financial transactions by integrating transparency
CoinOtag
You can visit the page to read the article.
Source: CoinOtag
Tags :
News
Disclaimer: The opinion expressed here is not investment advice – it is provided for informational purposes only. It does not necessarily reflect the opinion of BitMaden. Every investment and all trading involves risk, so you should always perform your own research prior to making decisions. We do not recommend investing money you cannot afford to lose.
Bitcoin ETFs Garner $340.7M Inflows as Ethereum ETFs Record $307.8M Inflows: ETF Flows Report 04 Feb 2025
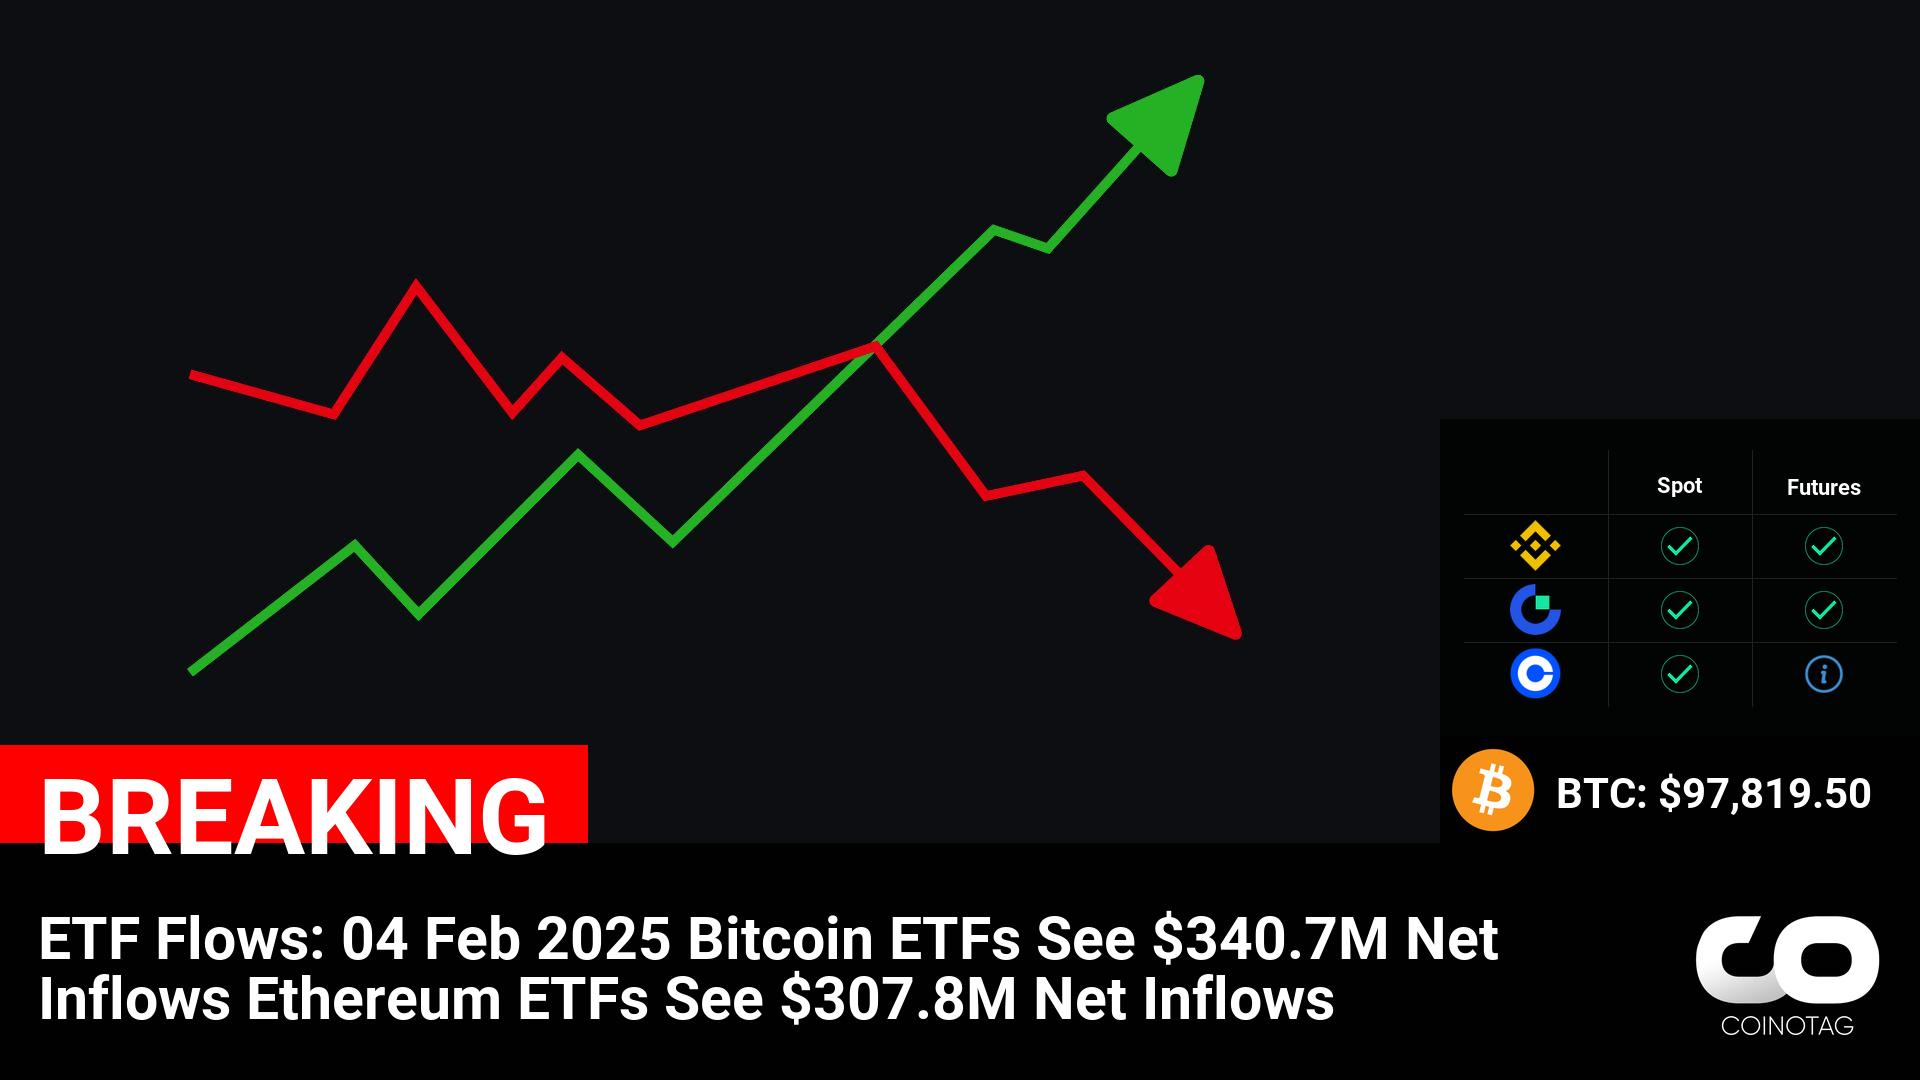
ETF Flows: 04 Feb 2025 Bitcoin ETFs See $340.7M Net Inflows Ethereum ETFs See $307.8M Net Inflows ————— ????Coin: Bitcoin ( $BTC ) $97,819.50 Ethereum ( $ETH ) $2,716.06 ————— CoinOtag
XRP Price Tests Critical Barrier: Will Bulls Lose Steam?
XRP price recovered most losses and rallied toward $2.75. The price is now facing hurdles near the $2.70 zone and might start another decline. XRP price started a strong upward move above the $2.60 level. The price is now trading below $2.70 and the 100-hourly Simple Moving Average. There is a new connecting bearish trend line forming with resistance at $2.710 on the hourly chart of the XRP/USD pair (data source from Kraken). The pair might start a fresh increase if it clears the $2.780 resistance zone. XRP Price Recovery Faces Resistance XRP price started a recovery wave from the $1.75 support zone, like Bitcoin and Ethereum . The price gained pace for a move above the $2.00 and $2.25 resistance levels. The bulls pumped the price above the $2.50 and $2.550 levels. However, the bears remained active below the $2.80 level. A high was formed at $2.780 and the price is now correcting gains. There was a move below the $2.62 level. The price dipped below the 23.6% Fib retracement level of the upward move from the $1.750 swing low to the $2.780 high. The price is now trading below $2.70 and the 100-hourly Simple Moving Average. On the upside, the price might face resistance near the $2.70 level. There is also a new connecting bearish trend line forming with resistance at $2.710 on the hourly chart of the XRP/USD pair. The first major resistance is near the $2.780 level. The next resistance is $2.80. A clear move above the $2.80 resistance might send the price toward the $2.940 resistance. Any more gains might send the price toward the $3.000 resistance or even $3.050 in the near term. The next major hurdle for the bulls might be $3.120. Another Decline? If XRP fails to clear the $2.70 resistance zone, it could start another decline. Initial support on the downside is near the $2.420 level. The next major support is near the $2.2650 level or the 50% Fib retracement level of the upward move from the $1.750 swing low to the $2.780 high. If there is a downside break and a close below the $2.2650 level, the price might continue to decline toward the $2.20 support. The next major support sits near the $2.050 zone. Technical Indicators Hourly MACD – The MACD for XRP/USD is now gaining pace in the bearish zone. Hourly RSI (Relative Strength Index) – The RSI for XRP/USD is now below the 50 level. Major Support Levels – $2.420 and $2.2650. Major Resistance Levels – $2.70 and $2.780. CoinOtag
See Also

XRP
-
XRP Ledger Recovers Following Brief ‘Network Drift’ Outage
35 dakika önce