7 hours ago
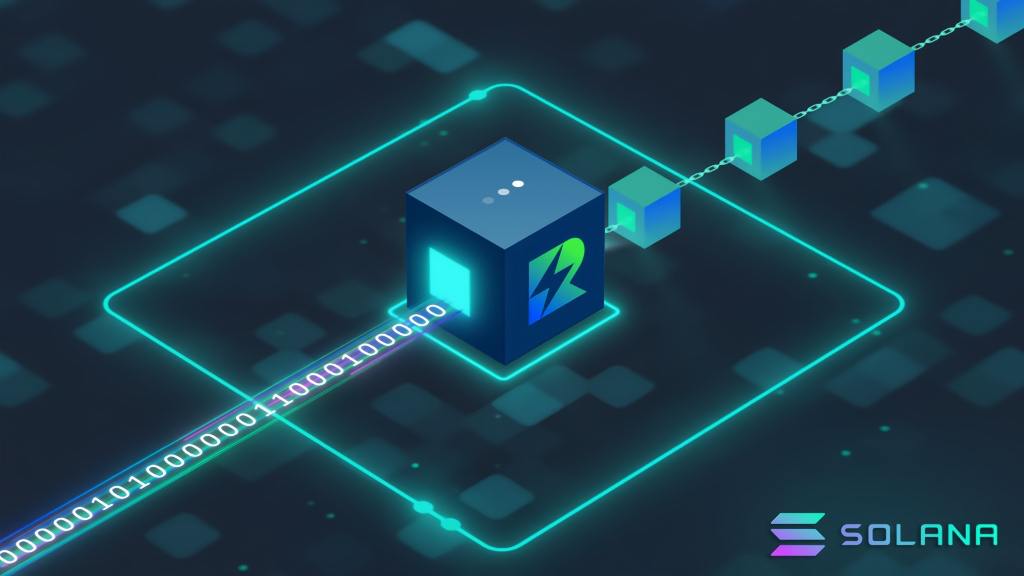
This content is provided by a sponsor. PRESS RELEASE. San Francisco – 12th March 2025: Rakurai, the infrastructure project supercharging Solana staking, has closed a $3 million seed funding round led by Anagram Ventures. Other investors in this round include Paper Ventures, Colosseum, Slow Ventures, Robot Ventures and Crypto.com. P2P.org, GlobalStake and Cyber Fund also
Bitcoin.com
You can visit the page to read the article.
Source: Bitcoin.com
Tags :
Press release
Disclaimer: The opinion expressed here is not investment advice – it is provided for informational purposes only. It does not necessarily reflect the opinion of BitMaden. Every investment and all trading involves risk, so you should always perform your own research prior to making decisions. We do not recommend investing money you cannot afford to lose.
The Rise of Zero-Knowledge Proofs – Revolutionizing Blockchain Privacy, Security and Scalability

HodlX Guest Post Submit Your Post Blockchain technology has transformed the financial landscape – b ut as it continues to evolve, the need for enhanced privacy, scalability and security has become more apparent. While blockchain networks like Ethereum ( ETH ) have made significant strides in their adoption, they still face challenges surrounding these core aspects. Enter ZKPs (zero-knowledge proofs) – a cryptographic breakthrough that is quickly becoming a game-changer in the blockchain world. In this article, we will explore how ZKPs are improving blockchain ecosystems by offering privacy-preserving features, enhancing scalability and enabling new use cases across industries. Understanding ZKPs At its core, a ZKP is a cryptographic protocol that allows one party to prove to another that a statement is true without revealing any additional information about the statement itself. In the context of blockchain, ZKPs can be used to verify transactions or other data on a network while keeping sensitive information private. For instance, a user could prove that they have enough funds to complete a transaction on a blockchain without disclosing the actual amount in their wallet or the details of the transaction. This concept of privacy – coupled with the ability to verify data without exposing it – is what makes ZKPs such a powerful tool for blockchain scalability and security. There are two primary types of ZKPs in the blockchain space. ZK-SNARKs (zero-knowledge succinct non-interactive argument of knowledge) – A powerful cryptographic technique that enables fast, non-interactive proofs. They are particularly useful for applications requiring scalability, such as Ethereum’s ZK-rollups. ZK-STARKs (zero-knowledge scalable transparent argument of knowledge) – These offer stronger security guarantees and are designed to be more scalable, as they don’t require a trusted setup, unlike ZK-SNARKs. ZKPs in action – b lockchain privacy and security As blockchain adoption grows, privacy concerns have become one of the most pressing issues for users and regulators alike. ZKPs offer an elegant solution to this problem. By allowing users to prove the validity of transactions without revealing any sensitive data, ZKPs help maintain privacy while still ensuring that the transaction is valid. A good example of ZKPs in action is Zcash ( ZEC ), a privacy-focused cryptocurrency that leverages ZK-SNARKs to allow private transactions. Zcash users can send funds without revealing the transaction amounts or addresses involved, making it one of the most secure and privacy-preserving blockchains in the crypto space. In addition to privacy, ZKPs provide an extra layer of security. By ensuring that data is only validated through cryptographic proofs, they significantly reduce the risk of fraudulent or malicious activity on the network. For enterprises and individuals looking to use blockchain technology for confidential applications, this is a huge advantage. Scalability – h ow ZKPs are enhancing blockchain networks While privacy and security are crucial, scalability remains a critical bottleneck for blockchain networks. As DApps (decentralized applications) and transactions grow in volume, traditional blockchain networks – especially those using PoW (Proof-of-Work) – struggle to keep up with demand due to network congestion and high fees. This is where ZK-rollups – a layer-two scaling solution based on ZKPs – come into play. ZK-rollups aggregate large numbers of transactions into a single proof, allowing the main chain to process them more efficiently. Since only a single proof needs to be posted on-chain, the scalability of the entire network improves dramatically, resulting in lower fees and faster transaction speeds. Ethereum, for example, has integrated ZK-rollups as part of its broader scalability solutions through the Ethereum 2.0 upgrade. Platforms like Loopring and zkSync have already begun utilizing ZK-rollups, significantly improving transaction throughput while maintaining the security of the Ethereum network. The real-world adoption of ZKPs The potential of ZKPs extends beyond just privacy and scalability. Several industry leaders and blockchain projects are already integrating ZKPs to solve real-world problems. Polygon – One of the most prominent layer-two solutions for Ethereum, Polygon is working on integrating ZK-rollups into its ecosystem to further improve scalability and reduce costs for DeFi users. StarkWare – By utilizing ZK-STARKs, StarkWare is enhancing scalability solutions for DApps and enterprise solutions. Optimism – While Optimism focuses on optimistic rollups, there is increasing exploration of how ZKPs can work in conjunction with optimistic rollups to improve overall system efficiency. As these examples show, ZKPs are not just theoretical – they are actively being used to address blockchain’s most pressing challenges. ZKPs – The future of blockchain privacy, scalability and innovation The continued development and adoption of ZKPs will play a pivotal role in shaping the future of blockchain technology. As more blockchain networks adopt ZKPs, we can expect to see increased privacy protections, reduced network congestion and greater scalability. This will unlock new opportunities for DeFi (decentralized finance), gaming and enterprise applications. Moreover, the ability to preserve privacy while maintaining full transparency will likely become a standard expectation in blockchain protocols. ZKPs are not only advancing the usability of blockchain networks but also paving the way for a future where blockchain is used for a wide range of applications – from secure voting systems and confidential data sharing to scalable financial services. Conclusion ZKPs are fast becoming a cornerstone of blockchain innovation. With their ability to enhance privacy, security and scalability, ZKPs will enable the next wave of growth and adoption for blockchain technology. As ZKPs continue to evolve, we are likely to see a transformation in the way blockchain networks operate – ushering in a more private, efficient and secure decentralized future. For developers, investors and blockchain enthusiasts, understanding ZKPs and their applications will be key to staying ahead in the rapidly advancing world of crypto innovation. Diksha Chawla is the founder of FinLecture , an insightful platform dedicated to making finance more accessible and understandable. With a strong academic background in business administration, Diksha is passionate about empowering individuals with the knowledge and tools they need to make informed financial decisions. Check Latest Headlines on HodlX Follow Us on Twitter Facebook Telegram Check out the Latest Industry Announcements Disclaimer: Opinions expressed at The Daily Hodl are not investment advice. Investors should do their due diligence before making any high-risk investments in Bitcoin, cryptocurrency or digital assets. Please be advised that your transfers and trades are at your own risk, and any loses you may incur are your responsibility. The Daily Hodl does not recommend the buying or selling of any cryptocurrencies or digital assets, nor is The Daily Hodl an investment advisor. Please note that The Daily Hodl participates in affiliate marketing. Generated Image: Midjourney The post The Rise of Zero-Knowledge Proofs – Revolutionizing Blockchain Privacy, Security and Scalability appeared first on The Daily Hodl . Bitcoin.com

Watch Out: XRP Faces Potential Downturn as Market Dynamics Shift
XRP is experiencing a significant price drop, with further declines possible. Technical patterns indicate critical support levels that could lead to deeper falls. Continue Reading: Watch Out: XRP Faces Potential Downturn as Market Dynamics Shift The post Watch Out: XRP Faces Potential Downturn as Market Dynamics Shift appeared first on COINTURK NEWS . Bitcoin.com
See Also


BNB


PEPE
-

TRUMP Token Takedown—Did Insiders Plan The Crash?
18 dakika önce