96 days ago
In a notable intersection of politics and cryptocurrency, MicroStrategy co-founder Michael Saylor advocates that France “could use some Bitcoin.” This comment follows a meeting with French politician Sarah Knafo, where
CoinOtag
You can visit the page to read the article.
Source: CoinOtag
Tags :
News BTC
Disclaimer: The opinion expressed here is not investment advice – it is provided for informational purposes only. It does not necessarily reflect the opinion of BitMaden. Every investment and all trading involves risk, so you should always perform your own research prior to making decisions. We do not recommend investing money you cannot afford to lose.
Stellar snaps its 5-month slump – Is this the start of XLM’s long-awaited rally?

Does this breakout light the fuse for a 30% sprint or will a stumble under $0.26 yank it back into the abyss? CoinOtag
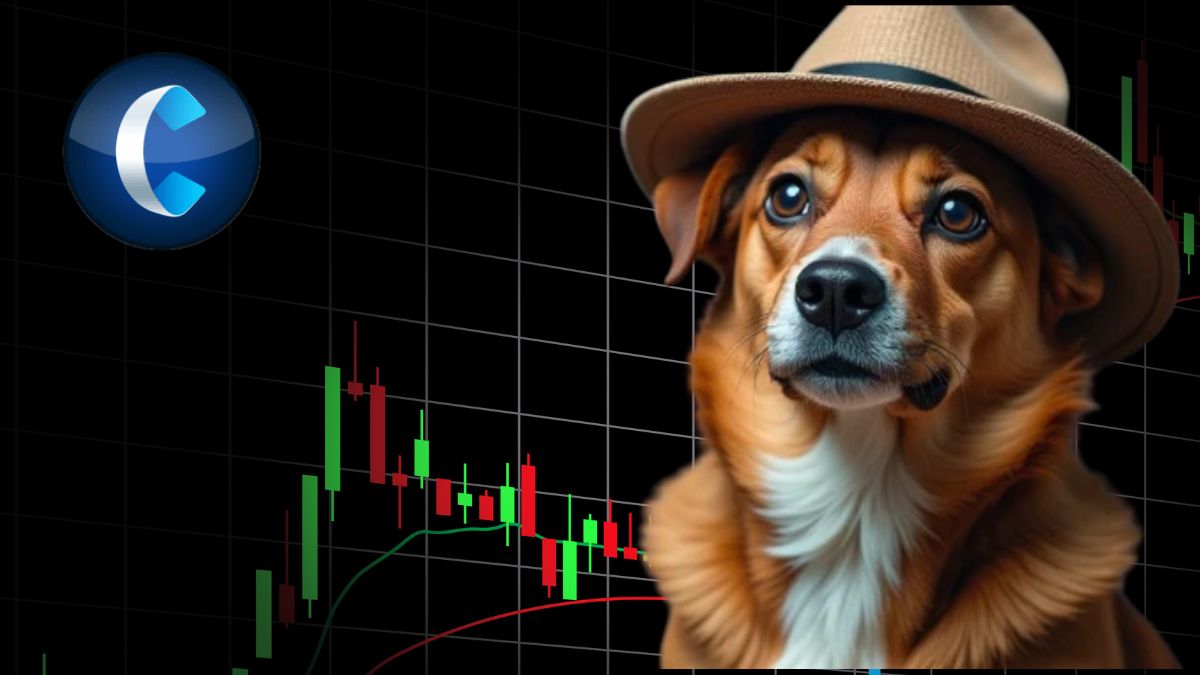
Dogwifhat (WIF) Price Surges Amidst Meme Coin Market Rebound, Pullback Risks Loom
WIF’s Impressive Price Performance Dogwifhat (WIF) has recently experienced a significant surge in value. The price of WIF has jumped by 60% over the past week and 21% in the last 24 hours. This impressive performance has contributed to the broader resurgence of the meme coin market. Currently, Dogwifhat (WIF) is priced at $0.6714, with … Continue reading "Dogwifhat (WIF) Price Surges Amidst Meme Coin Market Rebound, Pullback Risks Loom" The post Dogwifhat (WIF) Price Surges Amidst Meme Coin Market Rebound, Pullback Risks Loom appeared first on Cryptoknowmics-Crypto News and Media Platform . CoinOtag