7 hours ago
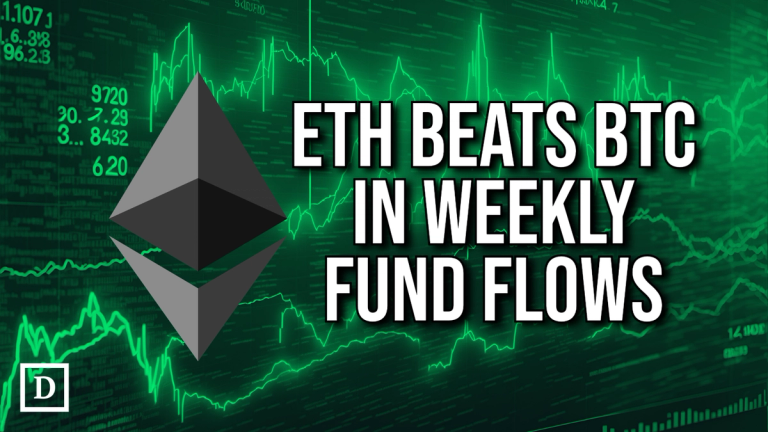
Digital asset investments last week recorded net inflows that were more than double the prior week despite market volatility triggered by President Donald Trump’s tariff announcements. Last week’s net inflows of $1.3 billion pushed total year-to-date investments to $7.3 billion, according to CoinShares` weekly fund flows report . In a twist, given ETH’s recent relative performance to BTC, Ethereum investment products outpaced Bitcoin in weekly inflows, attracting $793 million, while Bitcoin products attracted $407 million in inflows To continue reading this as well as other DeFi and Web3 news, visit us at thedefiant.io
The Defiant
You can visit the page to read the article.
Source: The Defiant
Tags :
Disclaimer: The opinion expressed here is not investment advice – it is provided for informational purposes only. It does not necessarily reflect the opinion of BitMaden. Every investment and all trading involves risk, so you should always perform your own research prior to making decisions. We do not recommend investing money you cannot afford to lose.
Dogecoin Eyes the Elusive $1 Mark with Historical Pattern Support

Dogecoin enthusiasts have something to wag their tails about as a historical pattern suggests a rally beyond the $1 threshold could be in the cards... The Defiant

Dogecoin (DOGE) Drifts Sideways—Will Bulls Step Up to the Challenge?
Dogecoin started a recovery wave above the $0.250 zone against the US Dollar. DOGE is now consolidating and might face hurdles near $0.2655. DOGE price started a recovery wave above the $0.2500 and $0.2520 levels. The price is trading above the $0.250 level and the 100-hourly simple moving average. There was a break above a connecting bearish trend line with resistance at $0.2515 on the hourly chart of the DOGE/USD pair (data source from Kraken). The price could start another increase if it clears the $0.260 and $0.2655 resistance levels. Dogecoin Price Faces Resistance Dogecoin price started a fresh decline from the $0.2940 resistance zone, like Bitcoin and Ethereum . DOGE dipped below the $0.280 and $0.2655 support levels. It even spiked below $0.250. A low was formed at $0.2388 and the price is now rising. There was a move above the 23.6% Fib retracement level of the downward wave from the $0.2933 swing high to the $0.2388 low. The price even cleared the $0.2500 resistance level. There was a break above a connecting bearish trend line with resistance at $0.2515 on the hourly chart of the DOGE/USD pair. Dogecoin price is now trading above the $0.250 level and the 100-hourly simple moving average. Immediate resistance on the upside is near the $0.260 level. The first major resistance for the bulls could be near the $0.2655 level or the 50% Fib retracement level of the downward wave from the $0.2933 swing high to the $0.2388 low. The next major resistance is near the $0.2725 level. A close above the $0.2725 resistance might send the price toward the $0.300 resistance. Any more gains might send the price toward the $0.320 level. The next major stop for the bulls might be $0.3420. Another Decline In DOGE? If DOGE’s price fails to climb above the $0.260 level, it could start another decline. Initial support on the downside is near the $0.2520 level. The next major support is near the $0.250 level. The main support sits at $0.2380. If there is a downside break below the $0.2380 support, the price could decline further. In the stated case, the price might decline toward the $0.2250 level or even $0.2120 in the near term. Technical Indicators Hourly MACD – The MACD for DOGE/USD is now gaining momentum in the bullish zone. Hourly RSI (Relative Strength Index) – The RSI for DOGE/USD is now above the 50 level. Major Support Levels – $0.2520 and $0.2500. Major Resistance Levels – $0.2600 and $0.2655. The Defiant

LTC
-

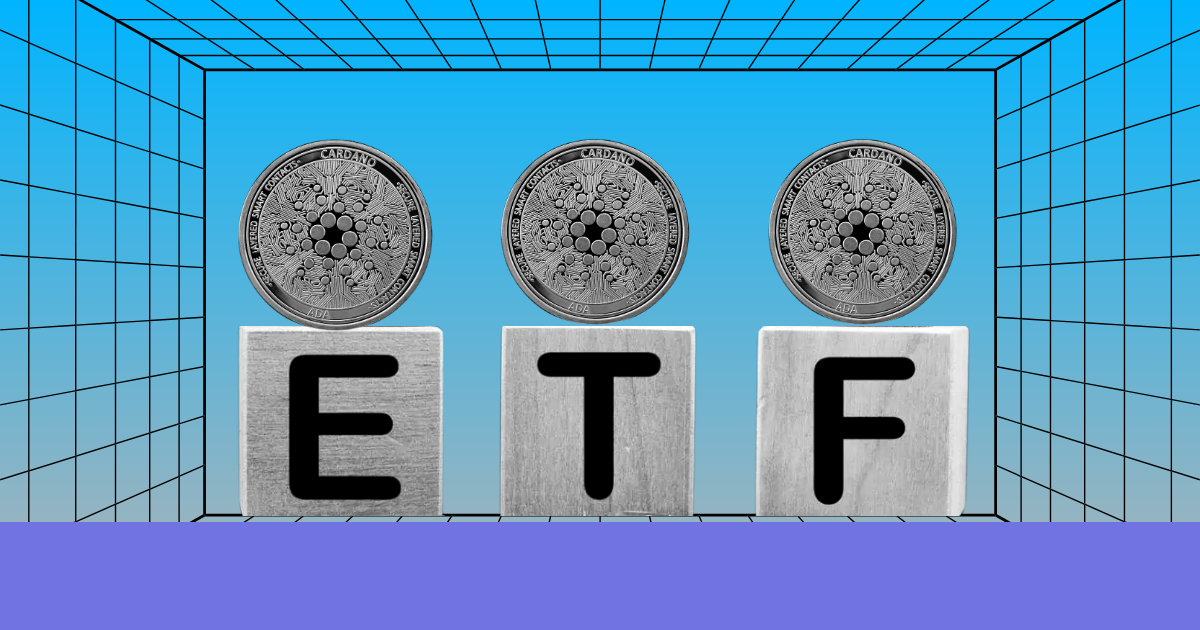
ADA Pumps 14% as Grayscale Files For Spot Cardano ETF
47 dakika önce