2 hours ago
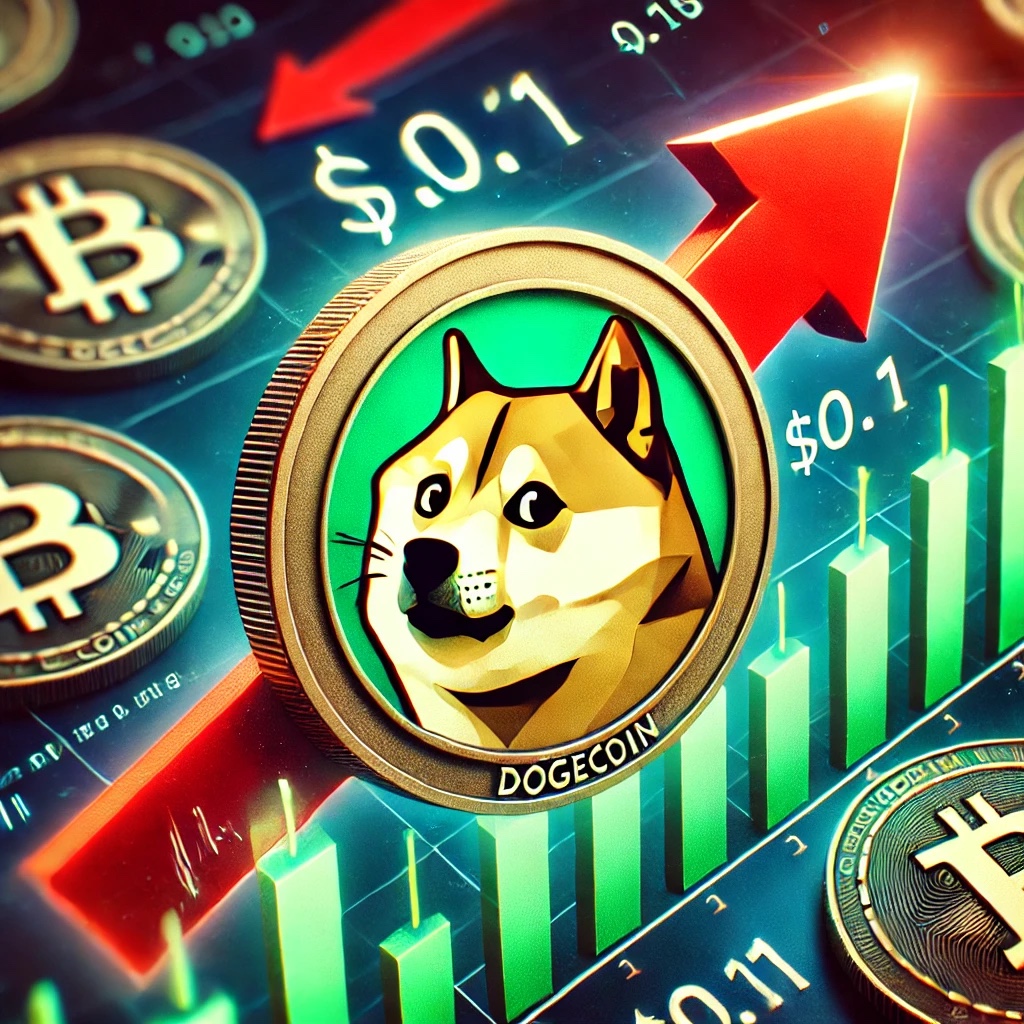
Dogecoin (DOGE), the meme-based cryptocurrency, has recently seen a sharp decline in price following a short rally to $0.12 last week. Amid this plunge in price performance, prominent crypto analyst Ali has identified key levels where its price needs to be reclaimed real soon, or there will be negative consequences. Related Reading: Dogecoin To The Moon? Trading Guru Sees A Bullish Breakout on the Horizon—Here’s Why Dogecoin: Reclaim $0.11 Or What? In a recent post on Elon Musk’s social media platform X, Ali highlighted the importance of the $0.11 price mark for Dogecoin, noting that approximately 60,210 addresses had purchased around 36.40 billion DOGE tokens at this level. He explained that these addresses represent significant support, and if the price remains below $0.11, holders might become increasingly inclined to sell their assets to mitigate potential losses. This selling pressure could accelerate DOGE’s downward trend. 60,210 addresses bought 36.40 billion $DOGE at $0.11! #Dogecoin must reclaim this level soon to sustain a bullish outlook. Otherwise, a failure to do so could lead to a sell-off as investors may seek to minimize losses. pic.twitter.com/BABwVfPGem — Ali (@ali_charts) October 3, 2024 DOGE’s Ongoing Decline: Beginning Of Another Bearish Trend? So far, Dogecoin has been on a downward trajectory, losing a significant portion of its gains from its recent rally. Over the past week, DOGE has dropped by 10.8%. The decline has continued into the past 24 hours, with the asset shedding 4.2% of its value, currently trading at around $0.1019. This price drop has directly impacted DOGE’s market capitalization, falling from over $17 billion last Thursday to around $14.9 billion today. Alongside this, the 24-hour trading volume for DOGE has also seen a noticeable decrease, from $1.4 billion last Thursday to just above $1 billion. While many in the crypto community are panicking concerning this bloodbath, analysts have continued to share their outlook and remain optimistic. Related Reading: Dogecoin On-Chain Spike Triggers 180% Price Rally Prediction—What’s Next? For instance, Trader Tardigrade, a popular crypto analyst, in a recent post on X, suggested that the recent dip in Dogecoin’s price may be a “retest” of its descending trendline following a recent breakout. According to Tardigrade, Dogecoin’s relative strength index (RSI), which measures the magnitude of recent price changes, shows a lower low while DOGE maintains a higher low position. According to technical analysis, this divergence could indicate a possible trend reversal in favor of a bullish move. Tardigrade concluded the post with advice noting: “Understand the TA [technical analysis], and you won’t be shaken out.” Featured image created with DALL-E, Chart from TradingView
NewsBTC
You can visit the page to read the article.
Source: NewsBTC
Tags :
Dogecoin altcoin crypto market cryptocurrency doge doge market Dogecoin analysis Dogecoin Price Prediction dogeusdt memecoin
Disclaimer: The opinion expressed here is not investment advice – it is provided for informational purposes only. It does not necessarily reflect the opinion of BitMaden. Every investment and all trading involves risk, so you should always perform your own research prior to making decisions. We do not recommend investing money you cannot afford to lose.
Active ETFs triumph over passives in fees from new flows

Record 70% income haul from fresh money is shot in the arm for active fund industry NewsBTC

Solana (SOL) Clings to Key Support: Is a Bounce Imminent?
Solana trimmed gains and tested the $132 support. SOL price is consolidating and might aim for a fresh increase above the $140 resistance zone. SOL price started a fresh decline below the $145 zone against the US Dollar. The price is now trading near $142 and the 100-hourly simple moving average. There was a break above a short-term bearish trend line with resistance at $136 on the hourly chart of the SOL/USD pair (data source from Kraken). The pair could start a recovery wave if it stays above the $132 support zone. Solana Price Revisits $132 Solana price started a fresh decline from the $162 resistance like Bitcoin and Ethereum. SOL declined below the $155 and $150 support levels. It even declined below $142. However, the bulls were active above the $132 support. A low was formed at $133.17 and the price is now consolidating losses. There was a move above the $135 level. The price climbed above the 23.6% Fib retracement level of the recent decline from the $1482 swing high to the $133 low. There was also a break above a short-term bearish trend line with resistance at $136 on the hourly chart of the SOL/USD pair. Solana is now trading below $142 and the 100-hourly simple moving average. On the upside, the price is facing resistance near the $140 level. The next major resistance is near the $142 level. It is close to the 61.8% Fib retracement level of the recent decline from the $1482 swing high to the $133 low. The main resistance could be $148. A successful close above the $148 and $150 resistance levels could set the pace for another steady increase. The next key resistance is near $155. Any more gains might send the price toward the $162 level. More Downsides in SOL? If SOL fails to rise above the $140 resistance, it could start another decline. Initial support on the downside is near the $135 level. The first major support is near the $132 level. A break below the $132 level might send the price toward the $120 zone. If there is a close below the $120 support, the price could decline toward the $112 support in the near term. Technical Indicators Hourly MACD – The MACD for SOL/USD is losing pace in the bearish zone. Hourly Hours RSI (Relative Strength Index) – The RSI for SOL/USD is below the 50 level. Major Support Levels – $135 and $132. Major Resistance Levels – $140 and $148. NewsBTC
See Also

BTC
-

All-Women AI PhD Program Launches in Africa
58 dakika önce


BTC
-
Bitcoin Spot ETF Outflow Hits $54.1M, IBIT Sees Inflows
42 dakika önce