2 hours ago
The post Did Ripple’s Victory Over the SEC Kickstart the Long-Awaited Altcoin Season? appeared first on Coinpedia Fintech News An analyst recently pointed out that we’ve been waiting for nearly three years for the cryptocurrency market explosion. While there have been many predictions in the past about when the market would take off, nothing major happened in 2023. Analyst Mathhew Perry explained that while some coins like Binance Coin and Solana are slightly down, …
coinpedia
You can visit the page to read the article.
Source: coinpedia
Tags :
News Altcoins Crypto news Price Analysis
Disclaimer: The opinion expressed here is not investment advice – it is provided for informational purposes only. It does not necessarily reflect the opinion of BitMaden. Every investment and all trading involves risk, so you should always perform your own research prior to making decisions. We do not recommend investing money you cannot afford to lose.
BNB Price Tops $600: Can the Rally Continue?

BNB price started a fresh increase above the $550 resistance zone. The price is now consolidating near $600 and might aim for more gains. BNB price started a fresh increase above the $550 resistance zone. The price is now trading below $580 and the 100-hourly simple moving average. There is a key bullish trend line forming with support at $585 on the hourly chart of the BNB/USD pair (data source from Binance). The pair must stay above the $575 level to start another increase in the near term. BNB Price Extends Rally In the past few days, BNB outperformed Ethereum and Bitcoin. It remained stable above $535 and started another increase above the $542 resistance zone. There was a move above the $550 and $565 resistance levels. The price even surged above $580 and tested the $600 resistance zone. A high is formed at $599.7 and the price is now consolidating above the 23.6% Fib retracement level of the upward move from the $576 swing high to the $600 high. The price is now trading below $585 and the 100-hourly simple moving average. There is also a key bullish trend line forming with support at $585 on the hourly chart of the BNB/USD pair. It is close to the 61.8% Fib retracement level of the upward move from the $576 swing high to the $600 high. If there is a fresh increase, the price could face resistance near the $600 level. The next resistance sits near the $608 level. A clear move above the $608 zone could send the price higher. In the stated case, BNB price could test $620. A close above the $620 resistance might set the pace for a larger move toward the $635 resistance. Any more gains might call for a test of the $650 level in the near term. Are Dips Supported? If BNB fails to clear the $600 resistance, it could start a downside correction. Initial support on the downside is near the $588 level. The next major support is near the $585 level and the trend line. The main support sits at $575. If there is a downside break below the $575 support, the price could drop toward the $560 support. Any more losses could initiate a larger decline toward the $550 level. Technical Indicators Hourly MACD – The MACD for BNB/USD is gaining pace in the bullish zone. Hourly RSI (Relative Strength Index) – The RSI for BNB/USD is currently above the 50 level. Major Support Levels – $585 and $575. Major Resistance Levels – $600 and $608. coinpedia

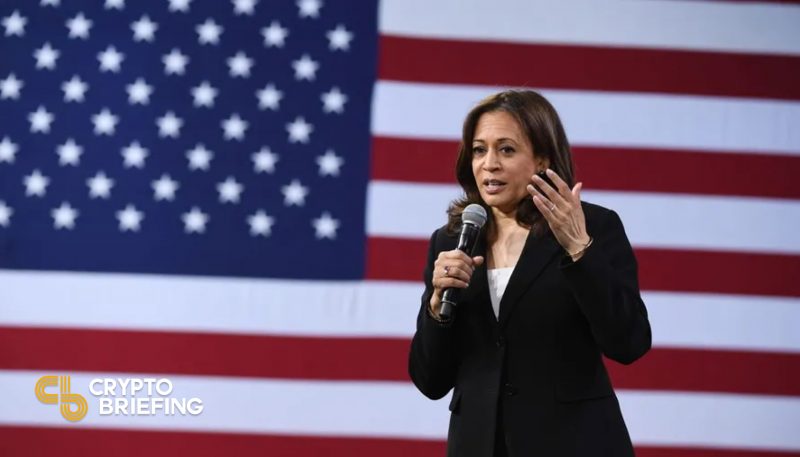
US VP Kamala Harris Pledges to Boost AI and Cryptocurrency in Economic Agenda
US VP Kamala Harris Pledges to Boost AI and Cryptocurrency in Economic Agenda During a recent fundraiser in New York City on September 22, U.S. Vice President Kamala Harris highlighted her commitment to advancing innovative technologies like artificial intelligence (AI) and cryptocurrencies as part of her broader economic agenda. If elected president, Harris emphasized that coinpedia