19 hours ago
Circle Internet Group, Inc., the company behind the $58 billion USDC stablecoin, said on Thursday it plans to bring its recently acquired Hashnote Tokenized Money Market Fund (TMMF) under Bermuda’s regulatory oversight. The fund, which manages nearly $1 billion assets, will be incorporated into Circle’s existing Digital Assets Business Act (DABA) license, the company said in a press release . Hashnote issues USYC, the largest tokenized money market fund, according to rwa.xyz data. By integrating USYC with USDC, Circle aims to allow seamless movement between a yield-bearing asset and one of the most widely used stablecoins and boost USYC as a collateral option on exchanges, custodians and prime brokers. Circle CEO Jeremy Allaire emphasized Bermuda’s role in digital asset regulation, calling it a “natural choice” for USYC operations. The Bermuda Monetary Authority (BMA) first granted Circle a comprehensive license in 2021, and the firm has since maintained a presence in the jurisdiction. "Digital financial products like USYC and USDC are strengthening Bermuda’s digital connectivity and our leadership in international business markets," Premier of Bermuda David Burt said in a statement.
CoinDesk
You can visit the page to read the article.
Source: CoinDesk
Tags :
Finance Tokenized Assets Real World Assets Circle Hashnote
Disclaimer: The opinion expressed here is not investment advice – it is provided for informational purposes only. It does not necessarily reflect the opinion of BitMaden. Every investment and all trading involves risk, so you should always perform your own research prior to making decisions. We do not recommend investing money you cannot afford to lose.
Crypto Price Analysis March-14: ETH, XRP, ADA, SOL, and HYPE
This week, we examine Ethereum, Ripple, Cardano, Solana, and Hyperliquid in greater detail. Ethereum (ETH) Ethereum fell by 13% this week after the price failed to hold above $2,000. With this key psychological level lost, buyers have retreated to the support found at $1,800. This latest drop in price puts ETH at bear market levels not seen since 2023. In December 2024, this cryptocurrency entered into a downtrend that barely had any relief rallies since. This severe correction saw the price fall by almost 60% from its most recent high at $4,100. Looking ahead, Ethereum is in desperate search of a bottom that can stop this downtrend. It’s still uncertain if the support at $1,800 will be able to stop sellers so that it can start a recovery. Chart by TradingView Ripple ( XRP ) Surprisingly, XRP continues to hold above $2 even though its price fell by 8% this week. Somehow, buyers managed to stop any pressure from sellers at this key level, which has already been tested several times. At the time of this post, the asset is found around $2.3 and will need to move above $2.4 if it hopes to re-test the key resistance at $3. XRP has a good shot at that if buyers pick up momentum in the coming days. Looking ahead, XRP looks much better than most altcoins making lower lows, like Ethereum. This makes it an outlier that may be quick to move higher once market sentiment improves. That would be confirmed if the $3 resistance is broken later on. Chart by TradingView Cardano (ADA) ADA had a difficult week after it crashed by 18% and returned to the key support at $0.64. So far, the price seems to hold above this level, but the momentum remains bearish even if the it was briefly above $1 at the start of March. The resistance is found at $0.9 and this level has to turn into a key support if ADA is to return on an uptrend. Considering the overall altcoin market remains bearish, it is hard to see Cardano becoming an outlier. Looking ahead, this cryptocurrency is found in a downtrend. Until this reverses, ADA’s price is likely to make new lows with $0.5 as a key level if the current support fails. Chart by TradingView Solana (SOL) Solana had another bad week. Its price fell by 12% after losing support at $134. With this level turned into key resistance, buyers have retreated to $105, which is currently the most important support level. The chart of SOL looks very similar to Ethereum. It’s making lower lows which is characteristic of a clear downtrend. It is unlikely that a reversal will happen any time soon, but the support around $100 is a good candidate for a relief rally, at least. Looking ahead, Solana may make new lows. If so, watch closely how the price will react around $100. Either way, this cryptocurrency must not lose a three-digit price, as that would be a major psychological blow to any bullish sentiment. Chart by TradingView Hyperliquid (HYPE) Hyperliquid entered the crypto space on a very high note with an excellent release of its HYPE token, which saw its valuation skyrocket in the first few weeks after launch. However, this sentiment quickly changed at the end of 2024. Since February, HYPE’s price has been in a downtrend. It closed the week with an 18% loss after the support at $15 turned into resistance. Buyers have now retreated to $11, which could provide some relief in the future if sellers continue to maintain pressure. Looking ahead, HYPE is found in a difficult spot with no clear reversal in sight. If nothing changes, the price could fall under $10 in the future. Such a discount could incentivize buyers to return and reverse this downtrend. Chart by TradingView The post Crypto Price Analysis March-14: ETH, XRP, ADA, SOL, and HYPE appeared first on CryptoPotato . CoinDesk
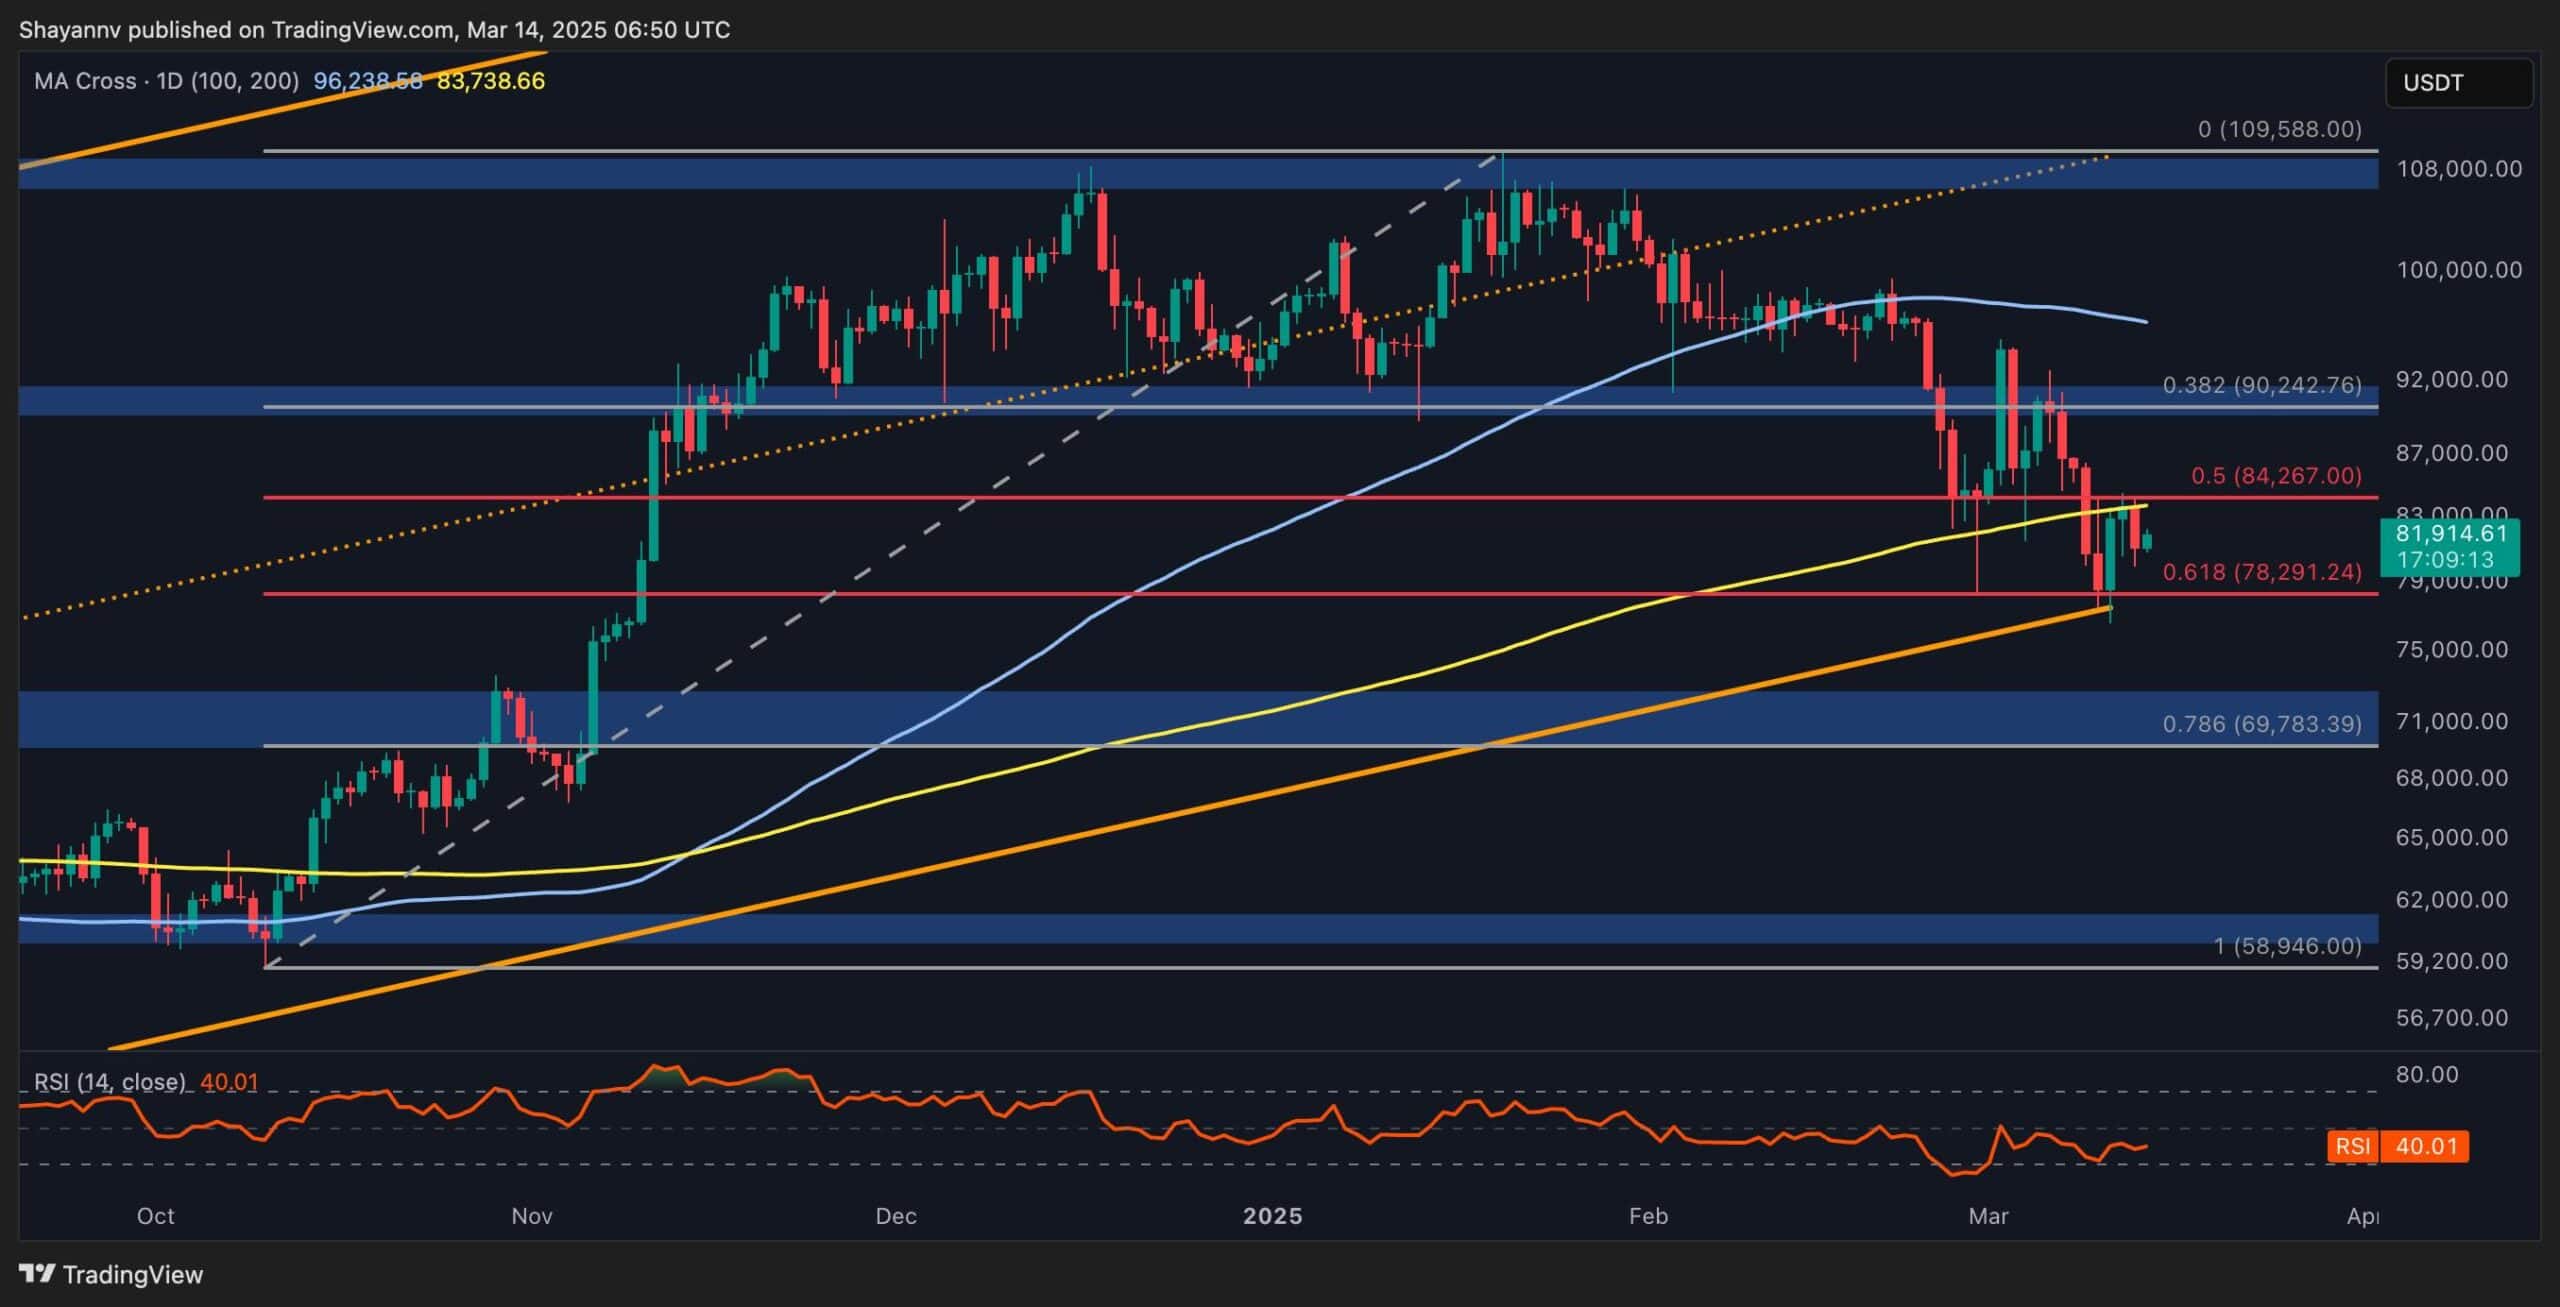
Bitcoin Price Analysis: BTC Risks Falling to $75K if This Resistance Breaks
Bitcoin is currently grappling with a crucial support region at the $80K mark, with sellers attempting to breach it. If a breakdown occurs, the asset’s next target will be the critical $75K level. Technical Analysis By Shayan The Daily Chart Bitcoin sellers have been struggling to maintain the significant support at the $80K price range, which aligns with both the ascending channel’s lower boundary and the 0.618 Fibonacci level. The confluence of these support regions suggests a strong demand zone that could support the price and halt further declines. However, if bearish momentum intensifies and sellers ultimately push below this decisive level, a drop toward the $75K mark will become likely. Bitcoin is currently trading within a tight range between $80K and $85K, and an impending breakout will provide a clearer outlook on the next move. The 4-Hour Chart On the lower timeframe, after dipping below the recent market low of $78K and triggering a liquidity hunt, BTC entered a consolidation phase, exhibiting slight volatility. The RSI indicator shows a bullish divergence, indicating that bearish momentum is fading and increasing the likelihood of a retracement toward the upper boundary of the descending wedge at $85K. In the short term, Bitcoin is expected to remain within this consolidation phase until a decisive breakout dictates the next trend. On-chain Analysis By Shayan Analyzing futures market sentiment has consistently provided valuable insights into Bitcoin’s price trends. One of the most significant indicators in this regard is the funding rates metric, which reflects whether buyers or sellers dominate the futures market. The chart shows that funding rates have been declining and even turning negative, signaling that sellers are aggressively opening leveraged short positions. While this pattern might initially appear bearish, it also mirrors the market behavior seen in the summer of 2024, when Bitcoin entered a prolonged corrective phase before staging a strong rally. This suggests that the market may have entered a deep consolidation stage, which could persist in the mid-to-long term before resuming its upward trajectory. The post Bitcoin Price Analysis: BTC Risks Falling to $75K if This Resistance Breaks appeared first on CryptoPotato . CoinDesk


SOL


XRP
-

Orderly surpasses $100 billion in cumulative trading volume
44 dakika önce