1 days ago
BONK’s recent trading pattern reflects significant bearish sentiment as it continues to navigate a challenging market landscape. Notably, the coin is struggling to maintain momentum above critical support levels that
CoinOtag
You can visit the page to read the article.
Source: CoinOtag
Tags :
News AUCTION BONK MEME
Disclaimer: The opinion expressed here is not investment advice – it is provided for informational purposes only. It does not necessarily reflect the opinion of BitMaden. Every investment and all trading involves risk, so you should always perform your own research prior to making decisions. We do not recommend investing money you cannot afford to lose.
Cardano Price Surge To $1.7: Here Are The Factors To Drive The Recovery

The Cardano price may be preparing for a powerful rally toward $1.7, as new indicators suggest a potential recovery. A leading crypto analyst has identified multiple bullish catalysts that could drive ADA’s momentum and help propel the cryptocurrency to this bullish target. Institutional Interest To Fuel Cardano Price Recovery According to a recent technical analysis by a pseudonymous TradingView analyst, ‘Risk_Adj_Return,’ the Cardano price is suddenly showing signs of recovery after a period of sluggish performance. This seemingly bullish turnaround has sparked predictions of a potential surge to $1.7. Related Reading: Cardano Price Prediction: ADA Set To Crash To $0.4 After Correction To Liquidity Zone According to the analyst’s report, several factors have been fueling ADA’s recovery. Despite its downtrend, large spot purchases have been observed, hinting at growing interest from institutional investors. The analyst also mentioned that political developments from key figures, such as US President Donald Trump, could spark further bullish sentiment for Cardano. Although many of the present institutional buy-ins for Cardano have been followed by sell-offs, possibly from short-term traders, the sheer volume suggests that major players are closely watching the market. Part of this renewed institutional interest is attributed to the US Federal Reserve (FED) and broader macroeconomic signals. Investors may be hoping for a shift in monetary policy or clear signs of easing inflation in the upcoming FOMC meeting, as this could boost risk assets like ADA. Any alignment between the Cardano price action and the FED decision could become a significant catalyst for upside momentum. In his Cardano price chart, the TradingView analyst highlighted a bullish long trade setup on the 4-hour timeframe, utilizing the Heikin-Ashi candles. The trading strategy is supported by multiple take-profit levels, with the entry point marked near Cardano’s current price range. A clear stop loss has also been placed just below the local support to manage downside risks. The trade plan involves three key take-profit levels: $0.73, $0.96, and $1.21. These targets align with previous resistance zones, allowing traders to potentially lock in gains before ADA reaches its ultimate upside target of $1.74. ADA Breakout Unlikely Amid US Trade Tensions The Cardano price is showing signs of strength, according to a market expert, ‘AMCrypto’, who notes that it is holding firm at a critical ascending support trendline on the 4-hour chart. After a recent decline, ADA bounced off the trendline, maintaining the bullish structure of an Ascending Triangle. Related Reading: Cardano Price Could Be Set For 100% Rally As This Bullish Triangle Has Formed On The Daily Timeframe Currently trading around $0.61, Cardano still faces resistance at $0.67. A confirmed close above this threshold could signal a breakout, potentially propelling its price toward the $0.73 – $0.75 range. However, despite these bullish technicals, macroeconomic uncertainty remains a key obstacle to ADA’s breakout potential. The ongoing US-China trade war tensions continue to fuel market volatility, creating headwinds for a sustained rally. The current market decline and instability fueled by this trade war have also kept many investors on the sidelines as they await stability. Featured image from Pixabay, chart from Tradingview.com CoinOtag

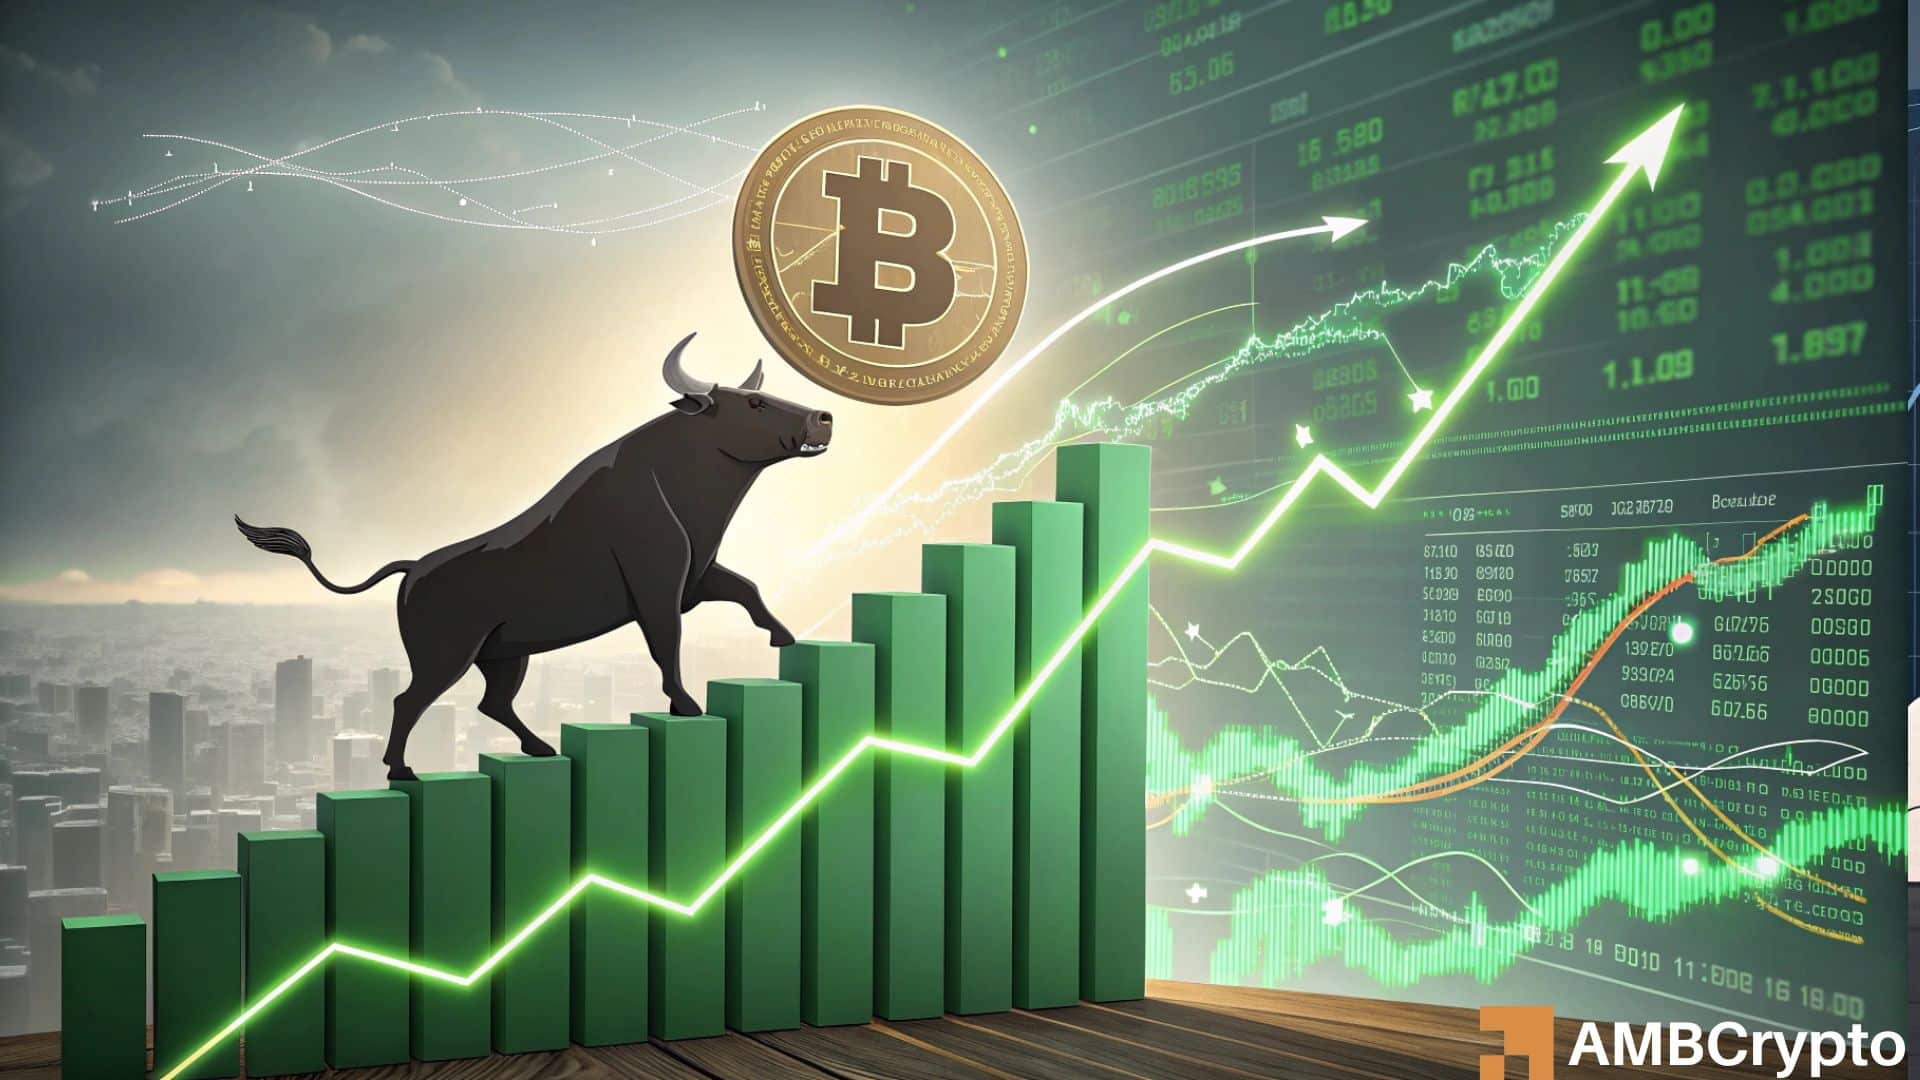
Bitcoin Stalls at $84K, But Analyst Says 2025 Could Mirror Last Year’s Breakout
Despite broader market interest, Bitcoin continues to hover near the $84,000 mark, showing limited upward momentum. At the time of writing, the asset is trading at $84,596, down 0.1% in the last 24 hours. This places BTC approximately 22% below its all-time high of over $109,000 set earlier this year. The price action follows a recovery from earlier lows but remains range-bound, suggesting hesitancy among investors as macroeconomic uncertainties persist. One of the emerging observations comes from CryptoQuant analyst Crypto Dan, who compared Bitcoin’s current behavior to past correction cycles. Related Reading: Bitcoin Sentiment Still Close To Extreme Fear—Green Sign For Recovery? Speculation Eases, Setting the Stage for Potential Recovery In Dan’s recent QuickTake post titled “Cryptocurrency Market, Similar to the 2024 Correction Period,” Dan assessed the speculative dynamics of the market through the lens of short-term holder activity. His analysis suggests that the recent cooling-off period might mirror patterns observed during last year’s correction phase. According to Dan, one reliable gauge of market overheating is the percentage of Bitcoin supply held for one week to one month. When this metric rises, it often signals speculative enthusiasm, which can precede corrections. During previous bullish phases, such increases in short-term holdings were followed by pullbacks, marking peaks in investor exuberance. In the current cycle, Dan notes that this metric has once again reached a region previously associated with market bottoms—the same yellow box (on the chart shared) that aligned with the 2024 correction low. Based on this, he posits that speculative excesses have largely subsided, opening the door to renewed price growth if macroeconomic conditions continue to improve. However, he also emphasized that further consolidation may still occur before a broader trend shift materializes. Crypto Market, Similar to the 2024 Correction “Given that this ratio has now reached the yellow-box region, which was the bottom of the 2024 correction period, it seems likely that the current market will follow a similar path as the 2024 correction.” – By @DanCoinInvestor pic.twitter.com/YGNZxQnUXj — CryptoQuant.com (@cryptoquant_com) April 18, 2025 Bitcoin Whale Activity Suggests Imminent Volatility Complementing this analysis, CryptoQuant contributor Mignolet pointed out a notable shift in coin movement behavior. In a separate post, he observed that around 170,000 BTC recently moved from the 3–6 month holding cohort. This group typically includes mid-term holders, and substantial activity from them has historically preceded increased price volatility. Related Reading: Bitcoin’s Futures Sentiment Weakens, Is The Ongoing Recovery Running Out of Steam? Mignolet illustrated his findings with data, noting that such movements have often signaled major price action, both upward and downward. Green box indicators on his chart marked rallies, while red boxes highlighted periods of decline. While the direction remains uncertain, he highlighted that the increased activity is an early warning sign that traders should be alert for a breakout or breakdown in the near future. Featured image created with DALL-E, Chart from TradingView CoinOtag