2 hours ago
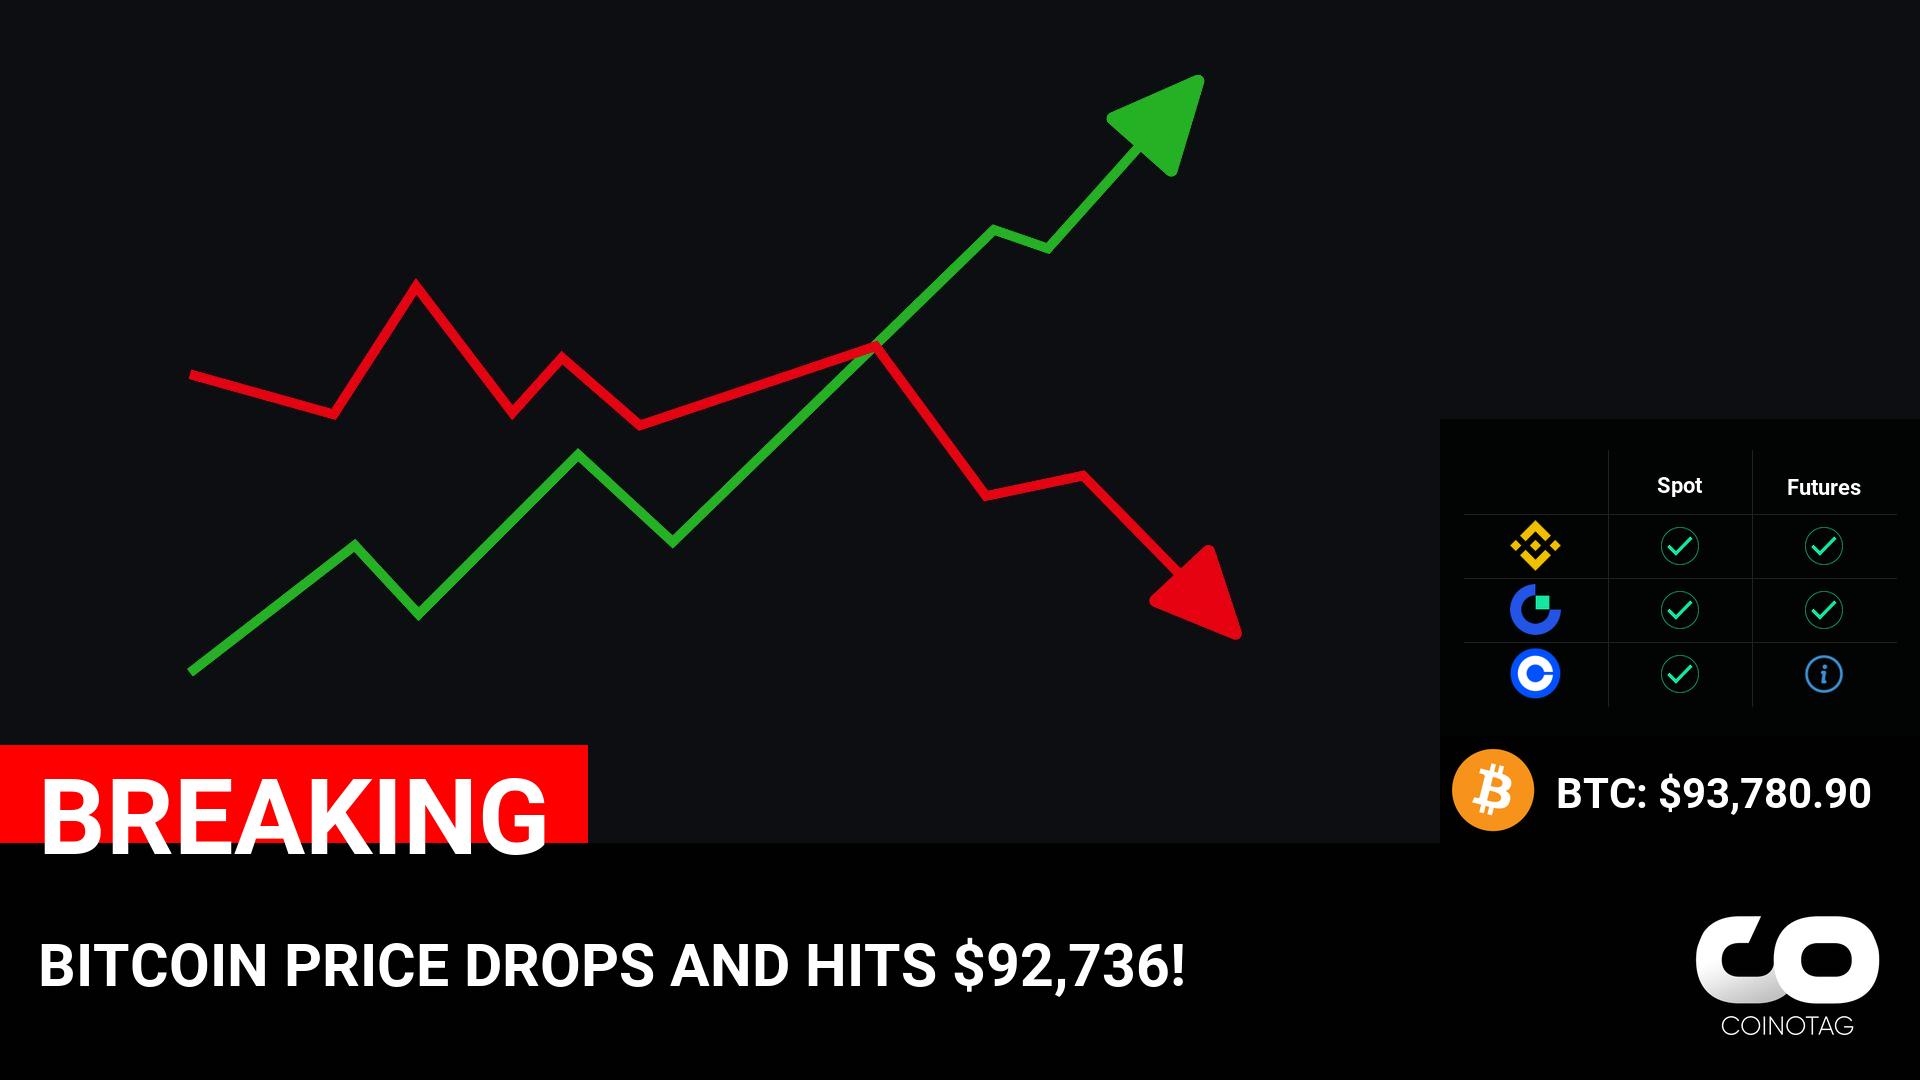
BITCOIN PRICE DROPS AND HITS $92,736! ————— ????Coin: Bitcoin ( $BTC ) $93,780.90 ————— NFA.
CoinOtag
You can visit the page to read the article.
Source: CoinOtag
Tags :
Disclaimer: The opinion expressed here is not investment advice – it is provided for informational purposes only. It does not necessarily reflect the opinion of BitMaden. Every investment and all trading involves risk, so you should always perform your own research prior to making decisions. We do not recommend investing money you cannot afford to lose.
Bitcoin Price Nosedives Nearly 10%: Panic or Buying Opportunity?

Bitcoin price started a fresh declined below the $100,000 zone. BTC is down close to 10% and might test the $90,000 support zone. Bitcoin started a fresh decline below the $100,000 level. The price is trading below $99,500 and the 100 hourly Simple moving average. There is a key bearish trend line forming with resistance at $96,200 on the hourly chart of the BTC/USD pair (data feed from Kraken). The pair could start another increase if it stays above the $90,000 zone. Bitcoin Price Dives Below $100,000 Bitcoin price started another decline below the $100,000 zone. BTC gained bearish momentum for a move below the $98,000 and $95,000 levels. It even dived below $93,000. A low was formed at $90,944 and the price is now consolidating losses . There was a minor increase above the $92,500 level. The price even tested the 23.6% Fib retracement level of the downward move from the $106,000 swing high to the $90,944 low. However, the bears are now active near the $95,000 zone. Bitcoin price is now trading below $95,000 and the 100 hourly Simple moving average . On the upside, immediate resistance is near the $95,000 level. The first key resistance is near the $96,500 level. There is also a key bearish trend line forming with resistance at $96,200 on the hourly chart of the BTC/USD pair. The next key resistance could be $98,400 or the 50% Fib retracement level of the downward move from the $106,000 swing high to the $90,944 low. A close above the $98,500 resistance might send the price further higher. In the stated case, the price could rise and test the $96,800 resistance level. Any more gains might send the price toward the $100,000 level. Another Decline In BTC? If Bitcoin fails to rise above the $95,000 resistance zone, it could start a fresh decline. Immediate support on the downside is near the $92,500 level. The first major support is near the $92,000 level. The next support is now near the $90,000 zone. Any more losses might send the price toward the $88,500 support in the near term. Technical indicators: Hourly MACD – The MACD is now gaining pace in the bearish zone. Hourly RSI (Relative Strength Index) – The RSI for BTC/USD is now below the 50 level. Major Support Levels – $92,500, followed by $90,000. Major Resistance Levels – $95,000 and $96,500. CoinOtag

Shiba Inu (SHIB) Sees Increased Burn Rate and Growing Shibarium Adoption Amid Market Fluctuations
Shiba Inu’s ecosystem is experiencing transformative changes as the Layer 2 solution, Shibarium, garners significant adoption within the crypto community. The remarkable surge in Shiba Inu’s 24-hour burn rate, coupled CoinOtag