3 hours ago
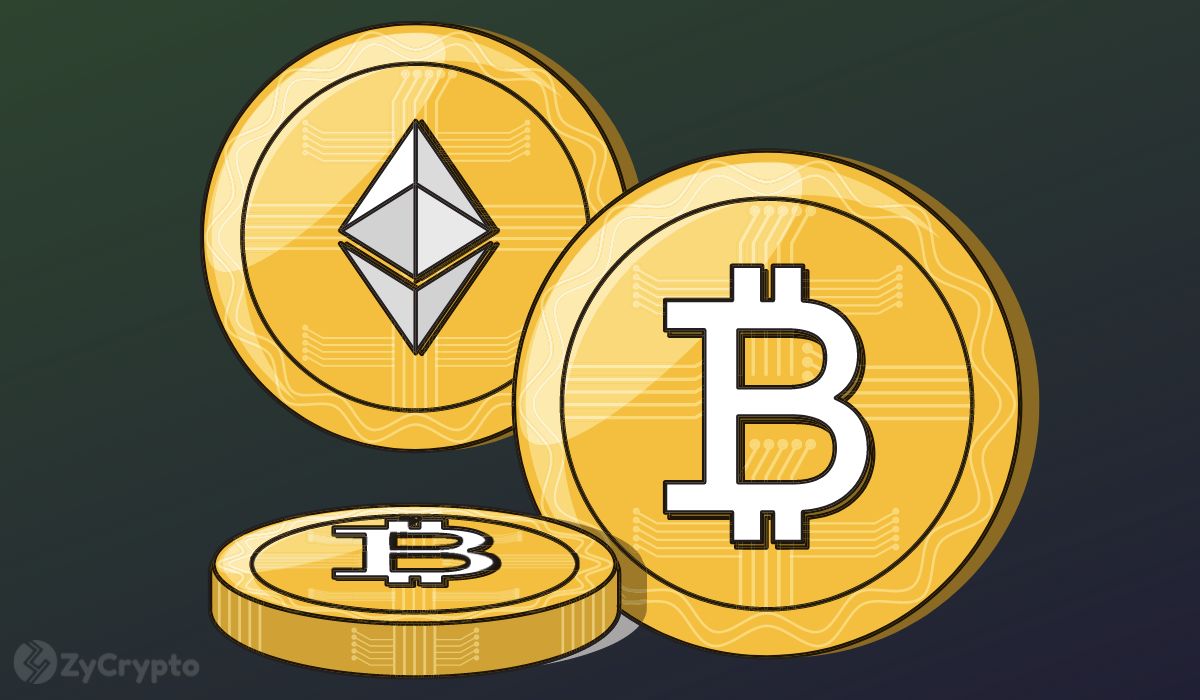
According to recent data from Coinglass, the cryptocurrency market experienced substantial net outflows over the past 24 hours, highlighting investor sentiment and market dynamics. Bitcoin led the trend with a
CoinOtag
You can visit the page to read the article.
Source: CoinOtag
Tags :
BTC ETH XRP
Disclaimer: The opinion expressed here is not investment advice – it is provided for informational purposes only. It does not necessarily reflect the opinion of BitMaden. Every investment and all trading involves risk, so you should always perform your own research prior to making decisions. We do not recommend investing money you cannot afford to lose.
Cardano Faces Severe Price Drop as Traders React to Market Volatility

Cardano`s price dropped by 25%, affecting trader confidence. Liquidations in ADA exceeded $40 million due to market volatility. Continue Reading: Cardano Faces Severe Price Drop as Traders React to Market Volatility The post Cardano Faces Severe Price Drop as Traders React to Market Volatility appeared first on COINTURK NEWS . CoinOtag
XRP Rally Fades—Price Surrenders Recent Gains
XRP price started a fresh decline from the $3.00 resistance. The price is up down over 20% and might extend losses below the $2.20 support. XRP price started a fresh decline from the $3.00 zone. The price is now trading below $2.50 and the 100-hourly Simple Moving Average. There was a break below a connecting bullish trend line with support at $2.40 on the hourly chart of the XRP/USD pair (data source from Kraken). The pair might continue to move down if it breaks the $2.20 support zone. XRP Price Reverses XRP price rallied above the $2.50 and $2.80 levels before the bears appeared, like Bitcoin and Ethereum . The price failed to clear the $3.00 resistance and started a fresh decline. There was a sharp move below the $2.80 and $2.60 levels. The price traded below the 50% Fib retracement level of the upward move from the $1.95 swing low to the $3.00 high. There was also a break below a connecting bullish trend line with support at $2.40 on the hourly chart of the XRP/USD pair. The price is now trading below $2.40 and the 100-hourly Simple Moving Average. It is now finding bids just above the 76.4% Fib retracement level of the upward move from the $1.95 swing low to the $3.00 high. On the upside, the price might face resistance near the $2.35 level. The first major resistance is near the $2.40 level. The next resistance is $2.4750. A clear move above the $2.4750 resistance might send the price toward the $2.620 resistance. Any more gains might send the price toward the $2.700 resistance or even $2.750 in the near term. The next major hurdle for the bulls might be $2.80. More Losses? If XRP fails to clear the $2.40 resistance zone, it could start another decline. Initial support on the downside is near the $2.20 level. The next major support is near the $2.120 level. If there is a downside break and a close below the $2.120 level, the price might continue to decline toward the $2.050 support. The next major support sits near the $2.00 zone. Technical Indicators Hourly MACD – The MACD for XRP/USD is now gaining pace in the bearish zone. Hourly RSI (Relative Strength Index) – The RSI for XRP/USD is now below the 50 level. Major Support Levels – $2.20 and $2.120. Major Resistance Levels – $2.40 and $2.4750. CoinOtag
See Also


MARKET
-
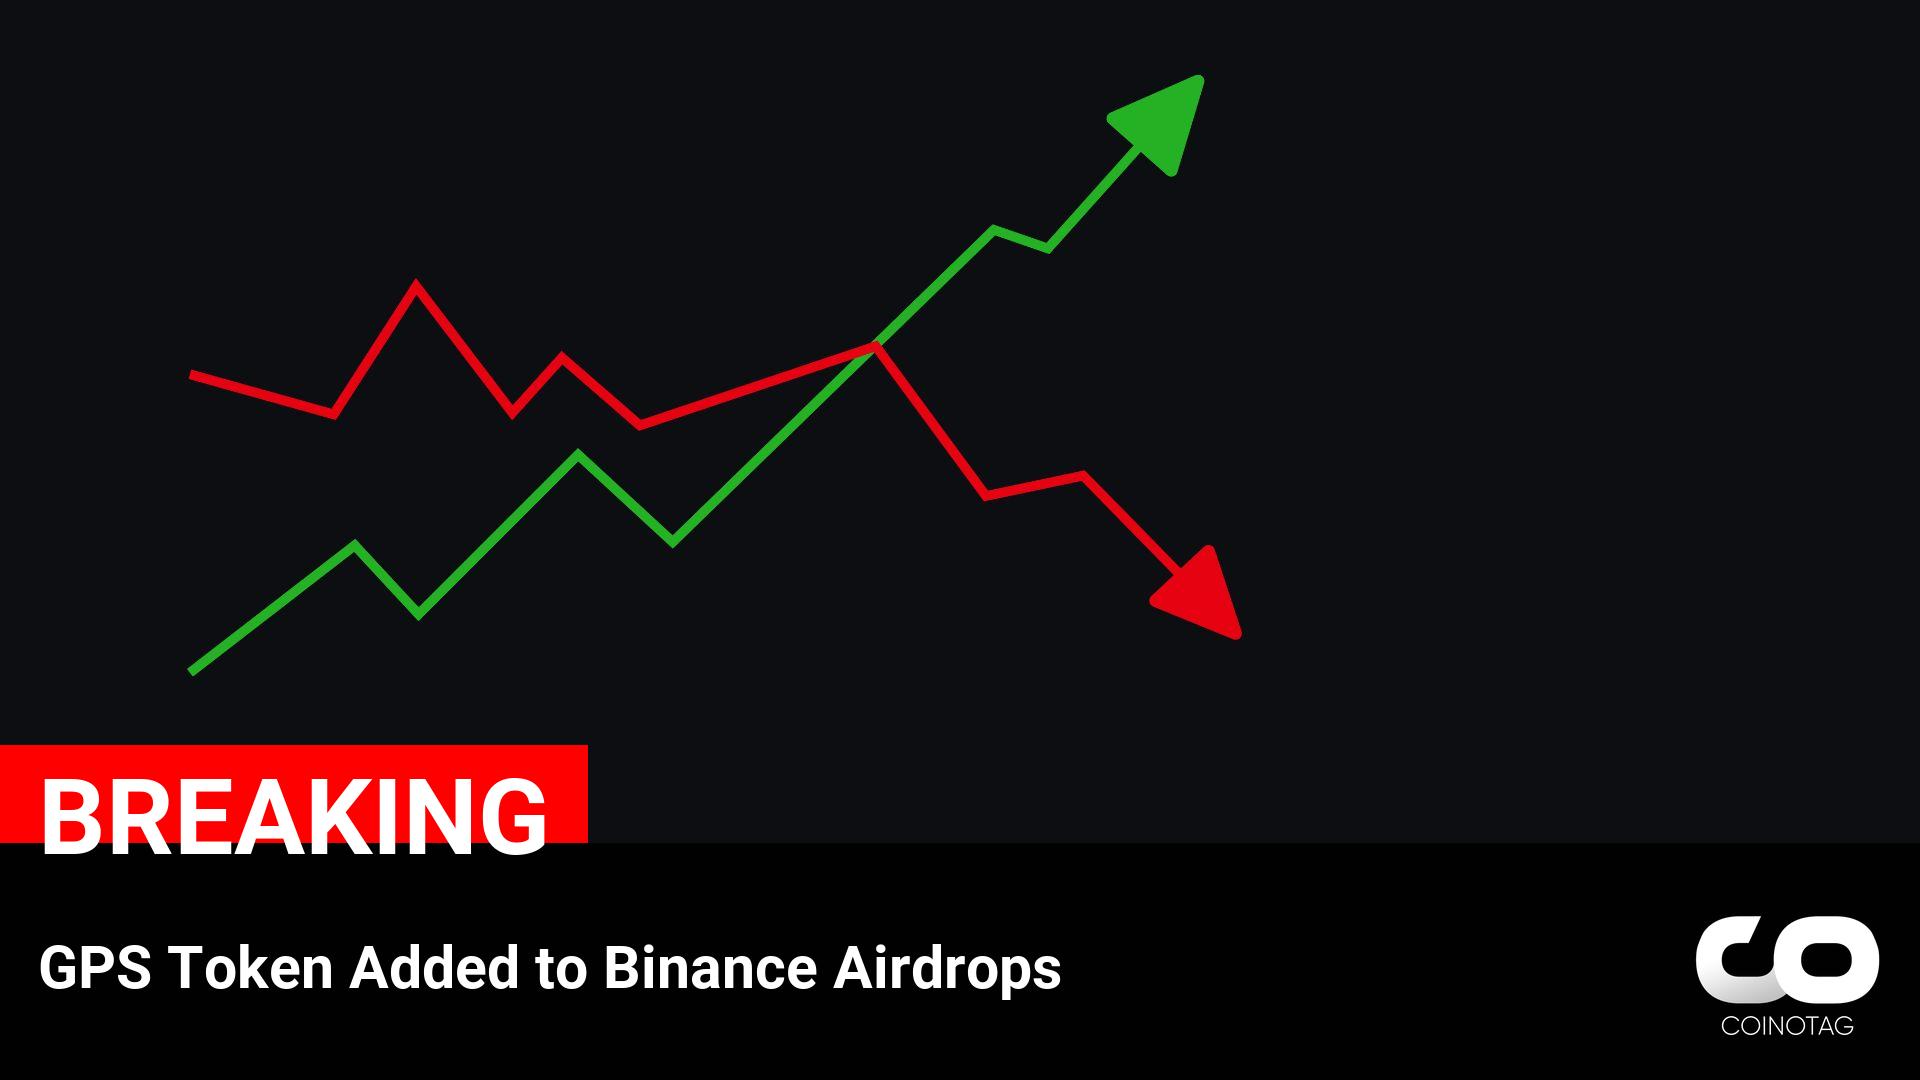
GPS Token Added to Binance Airdrops
2 saat önce