7 days ago
Bitcoin price started a fresh increase above the $80,000 zone. BTC is now correcting gains and might struggle to stay above the $79,500 support. Bitcoin started a fresh increase above the $80,000 zone. The price is trading above $79,500 and the 100 hourly Simple moving average. There is a new connecting bearish trend line forming with resistance at $80,500 on the hourly chart of the BTC/USD pair (data feed from Kraken). The pair could start another increase if it clears the $80,500 zone. Bitcoin Price Dips Again Bitcoin price started a fresh increase above the $77,500 zone. BTC formed a base and gained pace for a move above the $79,500 and $80,000 resistance levels. The bulls pumped the price above the $82,500 resistance. A high was formed at $83,548 and the price recently started a downside correction. There was a move below the $81,500 support. The price dipped below the 23.6% Fib retracement level of the upward move from the $74,572 swing low to the $83,548 high. Bitcoin price is now trading above $79,200 and the 100 hourly Simple moving average . On the upside, immediate resistance is near the $80,500 level. There is also a new connecting bearish trend line forming with resistance at $80,500 on the hourly chart of the BTC/USD pair. The first key resistance is near the $81,500 level. The next key resistance could be $82,500. A close above the $82,500 resistance might send the price further higher. In the stated case, the price could rise and test the $83,500 resistance level. Any more gains might send the price toward the $85,000 level. More Losses In BTC? If Bitcoin fails to rise above the $80,500 resistance zone, it could continue to move down. Immediate support on the downside is near the $79,500 level. The first major support is near the $79,000 level and the 50% Fib retracement level of the upward move from the $74,572 swing low to the $83,548 high. The next support is now near the $78,000 zone. Any more losses might send the price toward the $76,500 support in the near term. The main support sits at $75,000. Technical indicators: Hourly MACD – The MACD is now losing pace in the bullish zone. Hourly RSI (Relative Strength Index) – The RSI for BTC/USD is now above the 50 level. Major Support Levels – $79,500, followed by $79,000. Major Resistance Levels – $80,500 and $81,500.
NewsBTC
You can visit the page to read the article.
Source: NewsBTC
Tags :
BTC bitcoin bitcoin price btcusd BTCUSDT xbtusd
Disclaimer: The opinion expressed here is not investment advice – it is provided for informational purposes only. It does not necessarily reflect the opinion of BitMaden. Every investment and all trading involves risk, so you should always perform your own research prior to making decisions. We do not recommend investing money you cannot afford to lose.
Operator of Brazilian Crypto Ponzi Scheme Sentenced to 128 Years in Prison

The Brazilian justice system sentenced Joel Ferreira de Souza to 128 years, 5 months, and 28 days in prison. Souza was identified as the main operator of Braiscompany, a Brazilian crypto scheme that raised over $100 million from nearly 20,000 investors. Brazilian Crypto Ponzi Scheme Operators Receive Combined Sentences of Over 170 Years in Prison NewsBTC
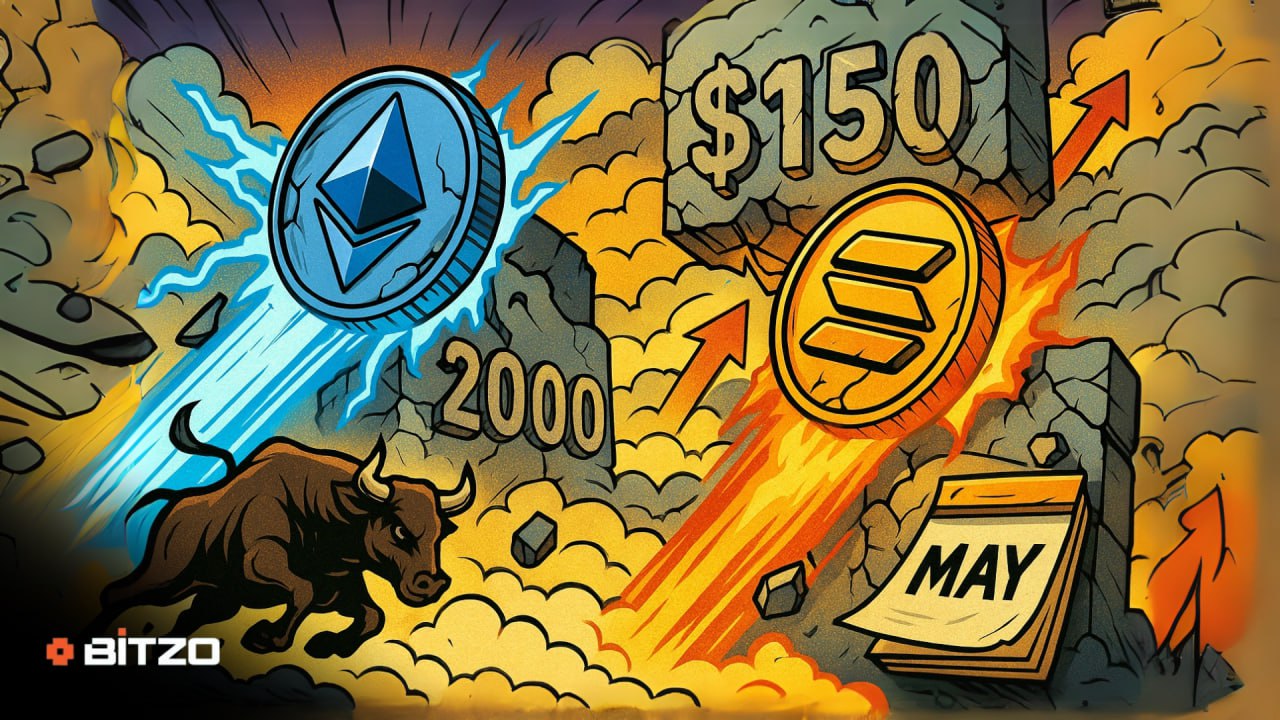
ETH Poised To Test $2000 And SOL Set To Challenge $150 In May – Key Factors That Could Drive A May Rally
Ethereum and Solana are gearing up for significant price movements this May. ETH is eyeing the $2000 mark, while SOL could surge to $150. Several factors are at play, hinting at a possible rally. This article delves into what could trigger these key price levels and which other coins might follow suit. Ethereum: Past Decline Meets a Cautious Current Range Ethereum experienced a significant drop over the last month with a decline of 18.22% and a half-year loss of 40.3%. The sold-off sentiment dampened momentum and left investors wary of the prolonged downturn. Price data from recent sessions reflect these steep losses and the weight of recent sell pressure while hinting at an opportunity for recovery if conditions stabilize. Currently, Ethereum trades between $1,538 and $2,325.86, with immediate support at $1,255.61 and resistance at $2,829.45. Bears dominate as the RSI hovers near 39, and technical signals indicate a modest bearish bias. Trading ideas include watching for dips near the support level and testing the resistance before committing to longer-term positions. SOL Price Dynamics Amid Shifting Momentum Solana saw a 7.14% gain over the past month while dropping 15.91% in the last six months. Price has moved between roughly $98 and $166, reflecting mixed performance during recent trading sessions. A one-week surge of 19.10% highlighted short-term gains, even as longer-term trends reveal some downside pressure. Current trading levels show clear markers, with support near $71 and resistance around $207, with a second resistance at about $275. Indicators suggest a cautious bullish outlook, with an RSI above 55 and modest moving averages. The overall trend remains uncertain, and traders might consider positions near these levels for short-term gains amid the volatile backdrop. Conclusion ETH and SOL show strong potential for significant growth in May. ETH is getting close to the $2000 mark, driven by increased investor interest and market activity. Meanwhile, SOL aims for $150 as it gains traction and attracts attention from both developers and users. These key factors suggest a promising upward trend for these tokens. Disclaimer: This article is provided for informational purposes only. It is not offered or intended to be used as legal, tax, investment, financial, or other advice. NewsBTC


ETH
-

XRP To $50? Technical Analyst Lays Out The Roadmap
20 dakika önce