3 hours ago
Binance to Support Terra Classic (LUNC) Network Upgrade ????Coin: Terra ( $LUNA ) $0.2187 LUNC ( $LUNC ) $0.00006624
CoinOtag
You can visit the page to read the article.
Source: CoinOtag
Tags :
Disclaimer: The opinion expressed here is not investment advice – it is provided for informational purposes only. It does not necessarily reflect the opinion of BitMaden. Every investment and all trading involves risk, so you should always perform your own research prior to making decisions. We do not recommend investing money you cannot afford to lose.
XRP Price Settles Lower—Will Sellers Push It Further Down?

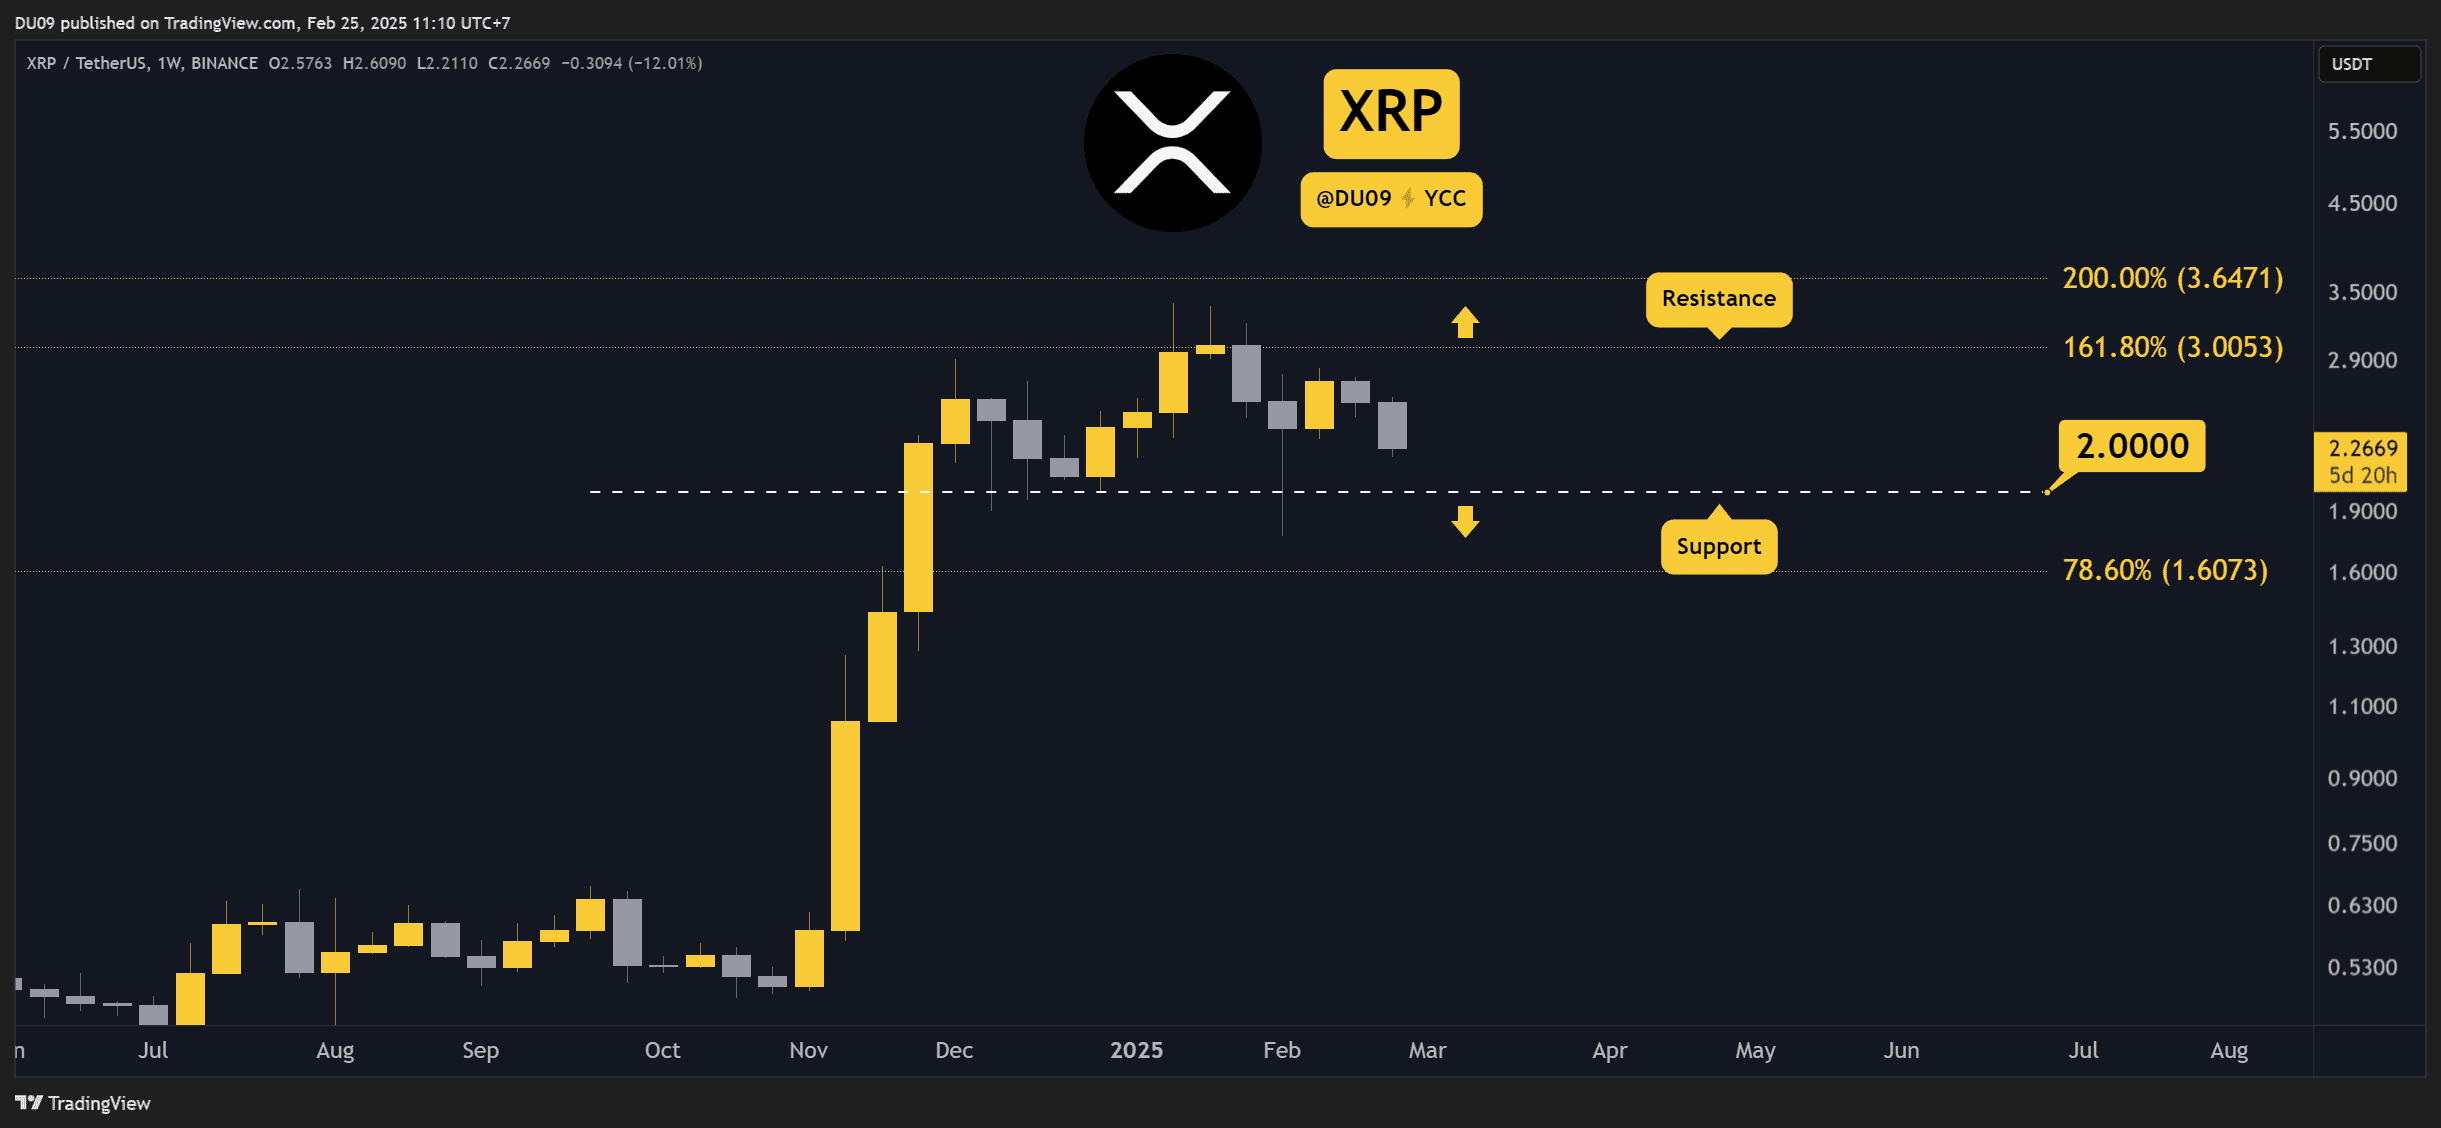
XRP price started a fresh decline below the $2.550 and $2.50 support levels. The price is now testing $2.250 and might continue to move down. XRP price started a fresh decline below the $2.50 level. The price is now trading below $2.50 and the 100-hourly Simple Moving Average. There is a key bearish trend line forming with resistance at $2.4880 on the hourly chart of the XRP/USD pair (data source from Kraken). The pair might continue to move down unless there is a close above the $2.50 resistance zone. XRP Price Dips Below Support XRP price failed to continue higher above the $2.75 resistance zone and started a fresh decline, like Bitcoin and Ethereum . There was a move below the $2.65 and $2.55 support levels. The price even dipped below the $2.50 support to enter a bearish zone. A low was formed at $2.2310 and the price is now attempting to recover toward the 23.6% Fib retracement level of the downward wave from the $2.7450 swing high to the $2.2310 low. The price is now trading below $2.50 and the 100-hourly Simple Moving Average. On the upside, the price might face resistance near the $2.3250 level. The first major resistance is near the $2.40 level. The next resistance is $2.4880 or the 50% Fib retracement level of the downward wave from the $2.7450 swing high to the $2.2310 low. There is also a key bearish trend line forming with resistance at $2.4880 on the hourly chart of the XRP/USD pair. A clear move above the $2.4880 resistance might send the price toward the $2.550 resistance. Any more gains might send the price toward the $2.620 resistance or even $2.650 in the near term. The next major hurdle for the bulls might be $2.750. More Losses? If XRP fails to clear the $2.3250 resistance zone, it could start another decline. Initial support on the downside is near the $2.250 level. The next major support is near the $2.220 level. If there is a downside break and a close below the $2.220 level, the price might continue to decline toward the $2.120 support. The next major support sits near the $2.050 zone. Technical Indicators Hourly MACD – The MACD for XRP/USD is now gaining pace in the bearish zone. Hourly RSI (Relative Strength Index) – The RSI for XRP/USD is now below the 50 level. Major Support Levels – $2.220 and $2.120. Major Resistance Levels – $2.40 and $2.4880. CoinOtag

SBF Puzzles Crypto Community with Recent X Posts
The disgraced crypto mogul has posted on X for the first time in two years CoinOtag


BUSINESS


DOGE
-
Ripple (XRP) Price Predictions for This Week
13 dakika önce